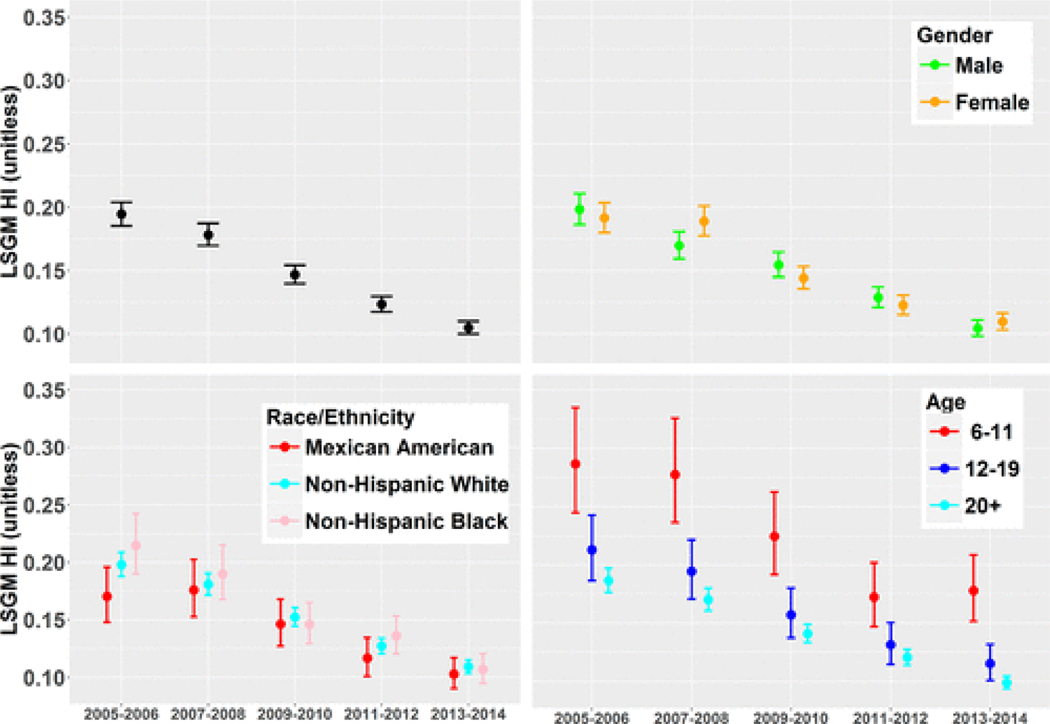
Figure 3.
Population least squares geometric mean (LSGM) with 95% confidence intervals of the hazard index (HI) of the surveyed NHANES population from six phthalates by cycle spanning from 2005 to 2014 presented overall (top left), by gender (top right), by race/ethnicity (bottom left), and by age (bottom right) adjusting for covariates and the NHANES survey weighting factors.

