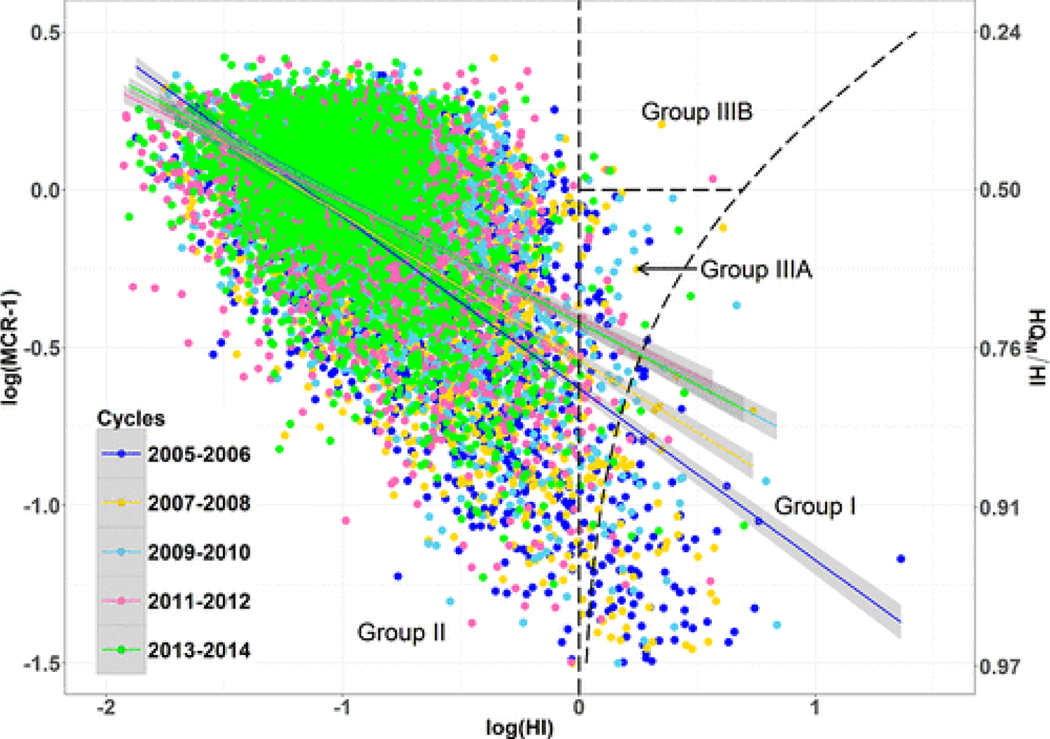
Figure 4.
Plot of log Hazard Index (HI) versus log(MCR – 1) (with HQM/HI) for all participants from the five NHANES cycles spanning from 2005 to 2014. Regions corresponding to Groups I, II, IIIA, and IIIB and linear regression between log HI with log(MCR – 1) with 95% confidence interval are presented. Regressions for cycles 2009–2010 and 2013–2014 overlap.

