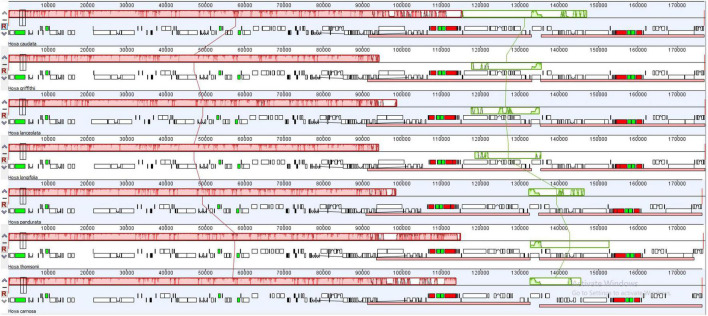
FIGURE 2.
Rearrangements in 7 Hoya plastomes using the mauve multiple alignment algorithm. Different colors represent different collinear blocks. The lines linking the collinear blocks represent homology between different genomes. The scale above each genome indicates nucleotide positions, and the white regions represent elements specific to a genome. IR contraction and expansion.

