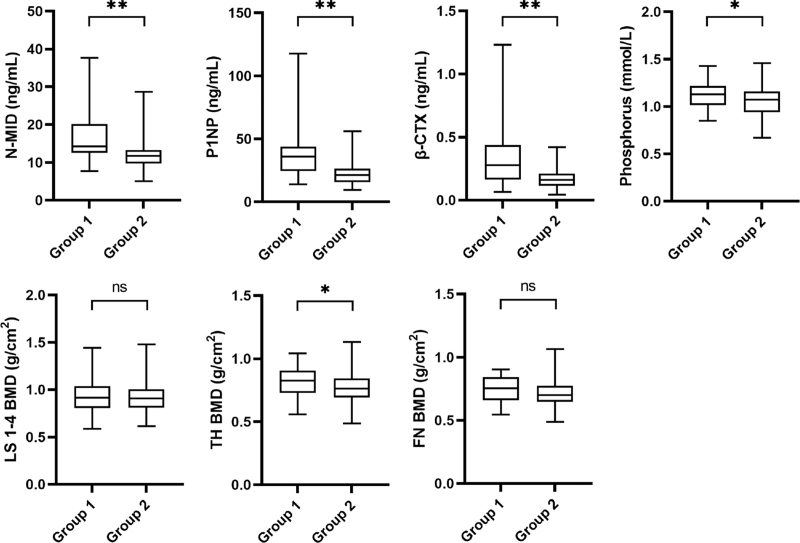
FIG. 2.
Comparison of the differences in N-MID, P1NP, β-CTX, Phosphorus, and BMD at 1 year follow-up between the two groups. All P values were calculated with the t test. ns, not significant. ∗P < 0.05. ∗∗P < 0.01. β-CTX, β-C-terminal telopeptide of type I collagen; BMD, bone mineral density; FN, femoral neck; LS, lumbar spine; N-MID, N-terminal middle segment osteocalcin; P1NP, propeptide of type I procollagen; TH, total hip.

