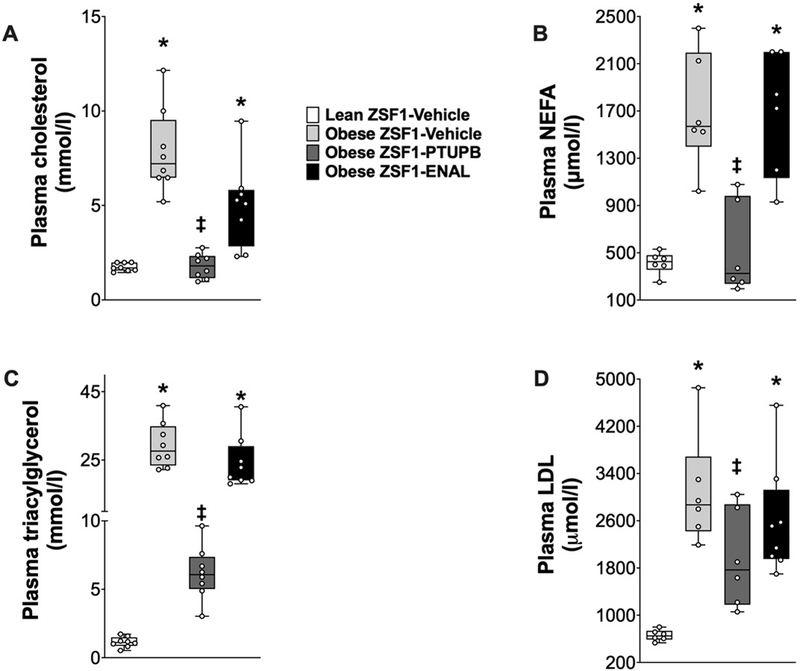
Figure 2: Circulating lipids in experimental groups.
Plasma levels of cholesterol (A), non-esterified free fatty acid (B), triglyceride (C), and LDL-cholesterol (D) at the end of the 8-week experimental protocol. *p<0.05 vs. lean ZSF1-Vehicle; ‡p<0.05 vs. obese ZSF1-Vehicle. ENAL = enalapril. Data are reported as box and whisker plots with median and minimum to maximum, n=6/group.

