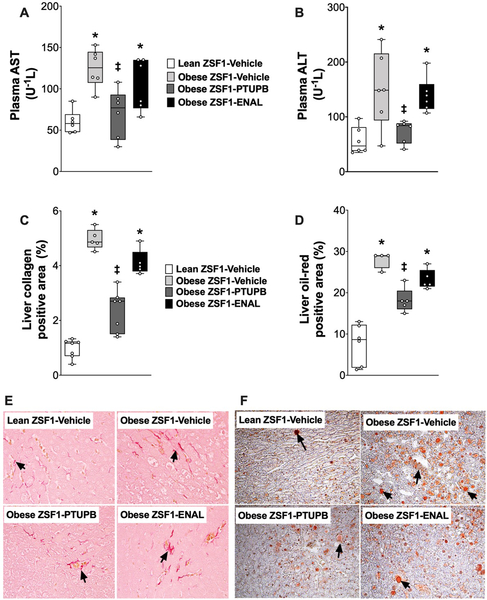
Figure 7: Liver injury in experimental groups.
Plasma levels of AST (A), ALT (B), calculated value of liver collagen positive area (C) and representative photomicrograph depicting collagen positive area (arrows) in the liver (E) at the end of the 8-week experimental protocol. Calculated values of oil o red positive (steatosis) liver area (D) and a representative photomicrograph liver steatosis (arrows) obtained from oil o red staining at the end of the 8-week experimental protocol (F). *p<0.05 vs. lean ZSF1-Vehicle; ‡p<0.05 vs. obese ZSF1-Vehicle. ENAL = enalapril. Data are reported as box and whisker plots with median and minimum to maximum, n=6/group.

