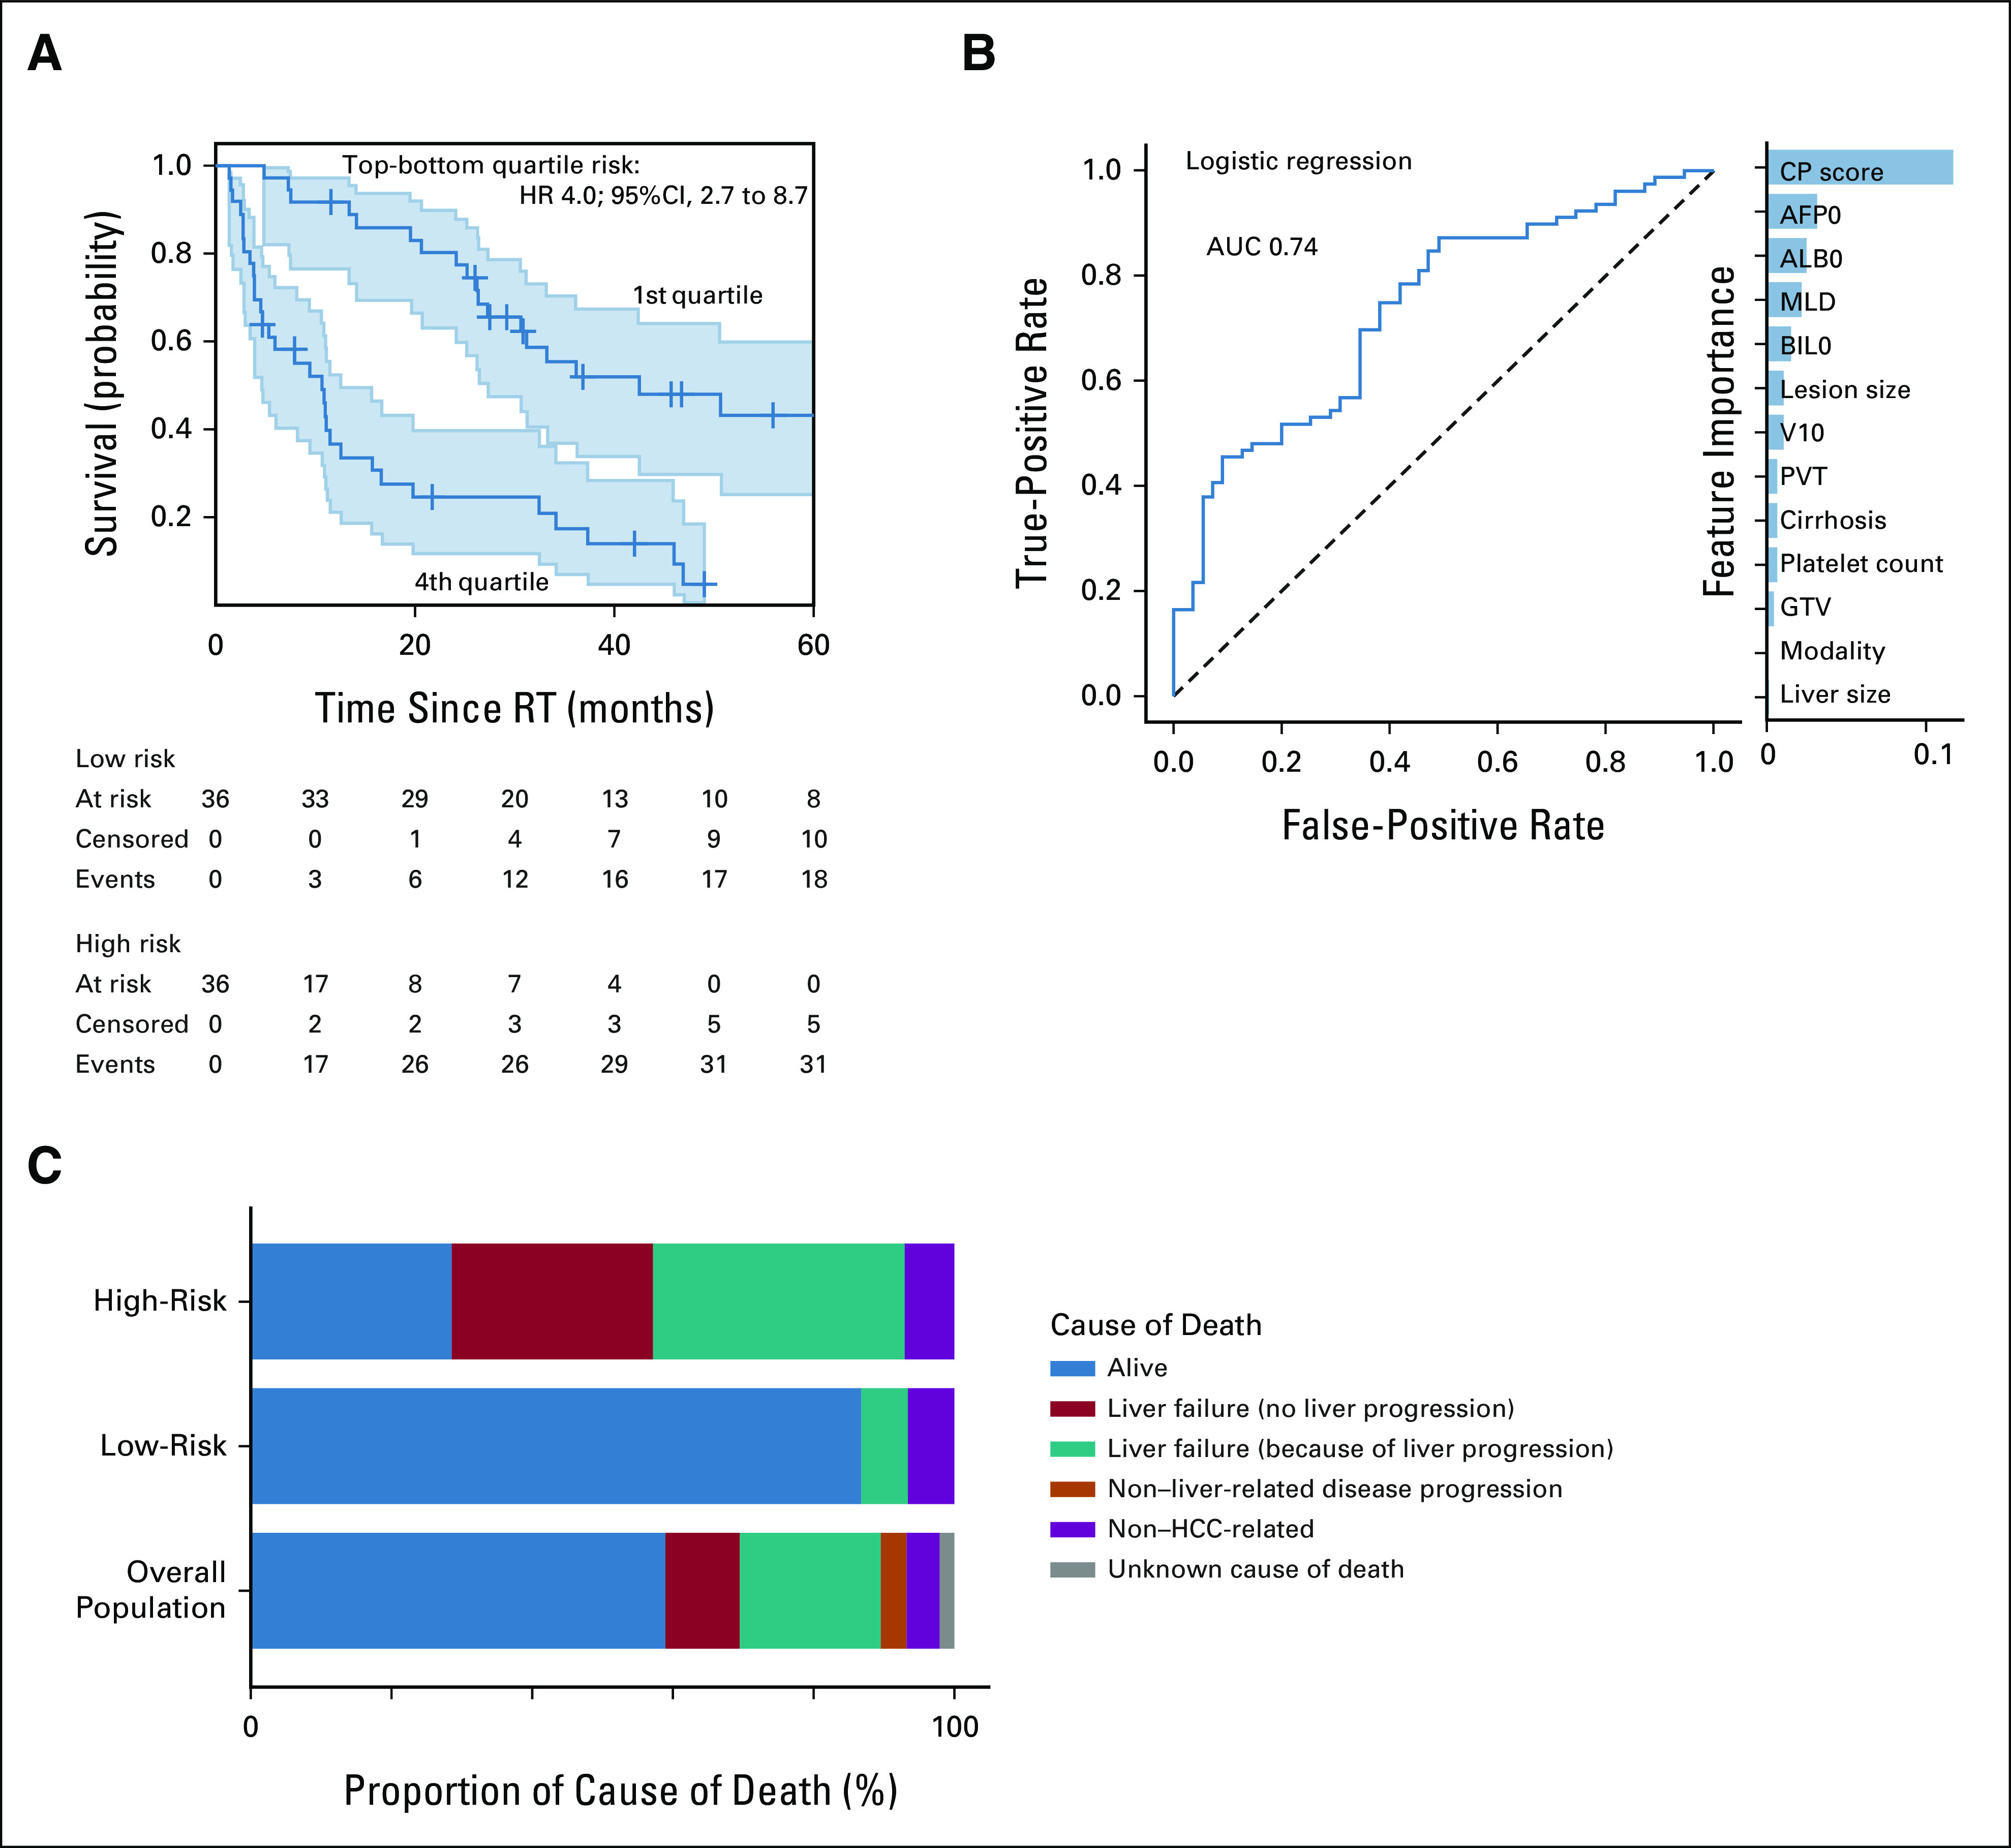
FIG 2.

Validation of the survival models on the external data set. (A) Stratification of patients on the basis of risk determined by the Cox prediction model showing the top and bottom quartile risk groups. (B) Receiver operating characteristic curve for predicting classifier of SRVy1 using logistic regression. Feature importance are on the right, where all features are measured before treatment. PVT, GTV, and V10 are the portal vein thrombosis, gross tumor volume, and 10 Gy dosimetric index, respectively. (C) Cause of death for patients scored high and low risk by the logistic model. AFP0, alpha-fetoprotein; ALB0, albumin; AUC, area under the curve; BIL0, bilirubin; CP, Child-Pugh; HCC, hepatocellular carcinoma; HR, hazard ratio; MLD, mean liver dose; RT, radiotherapy; SRVy1, 1-year survival.
