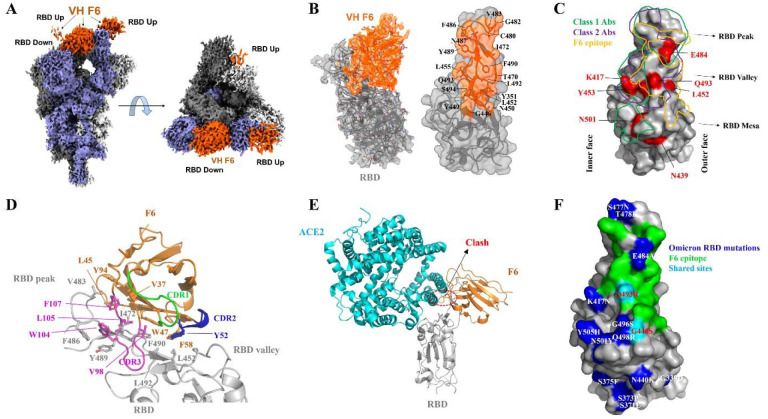
Fig. 2. CryoEM structure of VH F6 in complex with the SARS-CoV-2 Beta variant spike protein.
A. Global cryoEM map of the Beta variant spike protein in complex with VH F6. Density corresponding to the Beta variant trimer is colored in shades of grey and violet while density corresponding to VH F6 molecules is colored in orange. B. Left: Focus refined density map of the Beta variant RBD - VH F6 complex with docked atomic model. Right: Molecular surface representation of the epitope of VH F6 on the Beta variant RBD. The side chains of residues within the binding footprint of VH F6 are displayed and colored orange. C. Footprints of class 1 Abs (green), class 2 Abs (purple), and VH F6 (orange) on the molecular surface of the SARS-CoV-2 RBD. Commonly mutated and antibody-evading mutations are colored in red. D. Focused view of the atomic model at the VH F6 - RBD interface. The side chains of discussed residues are shown, with the scaffold colored orange, CDR1 green, CDR2 blue, CDR3 magenta and the RBD gray. E. Superposition of VH F6-RBD (orange) and ACE2-RBD (cyan) complex atomic models. The RBD is shown in grey and the ACE2-RBD model was derived from PBD ID: 6m0j. G. Mapping the Omicron mutations onto the RBD structure with comparison to the F6 epitope

