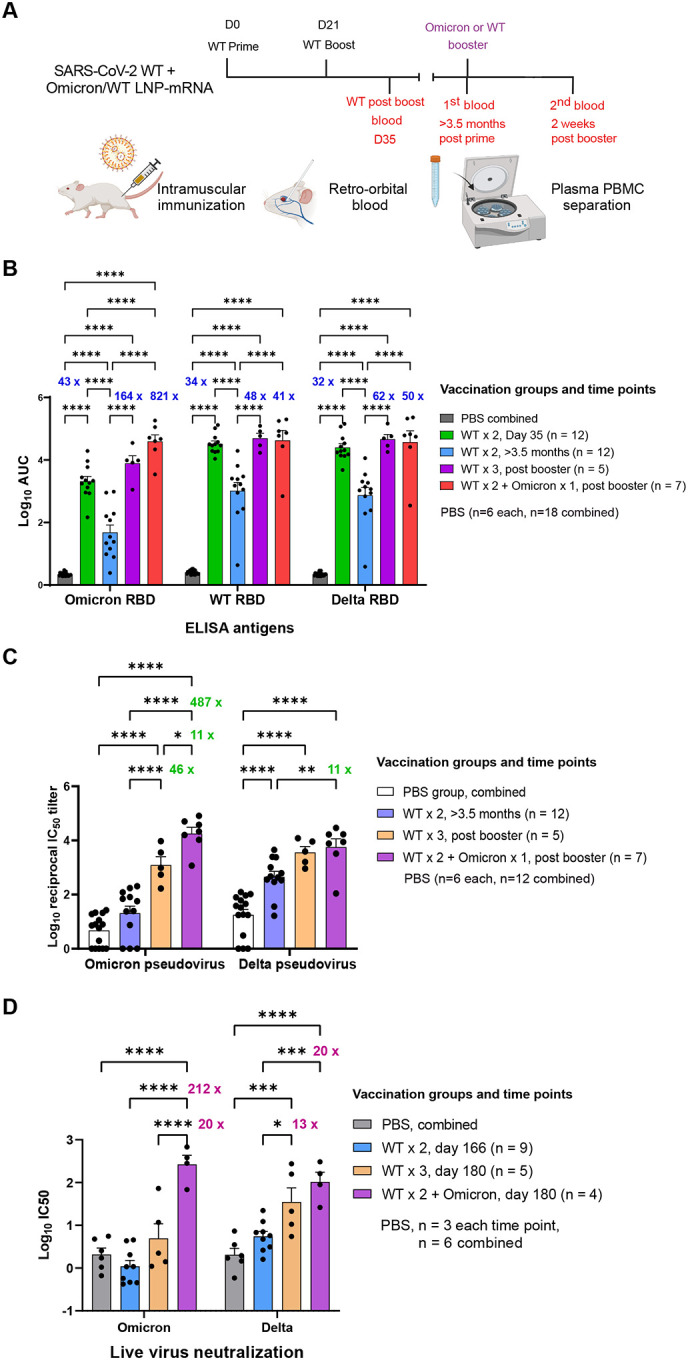
Figure 2. Heterologous booster with Omicron LNP-mRNA as compared to homologous booster with WT LNP-mRNA in mice that previously received a two-dose WT LNP-mRNA vaccination.

A, Schematics showing the immunization and blood sampling schedule of mice administered with 1 μg WT LNP-mRNA prime (WT × 1) and boost (WT × 2) as well as 10 μg WT or Omicron-specific LNP-mRNA booster shots. The data was collected and combined from two independent experiments shown in Extended Data Figures S2 and S3.
B, Bar graph comparing binding antibody titers of mice administered with PBS or WT and Omicron LNP-mRNA against Omicron, Delta and WA-1 RBD (ELISA antigens). The antibody titers were quantified as Log10 AUC based on titration curves in Extended Data Figure 1A. PBS sub-groups (n=6 each) collected from different matched time points showed no statistical differences between each other, and were combined as one group (n=18).
C, Pseudovirus neutralizing antibody titers in the form of log10-transformed reciprocal IC50 calculated from fitting the titration curve with a logistic regression model (n = 12 before booster, n=5 in WT × 3, n = 7 in WT × 2 + Omicron).
D, Infectious virus neutralization titer comparisons between mice before and after vaccination with WT or Omicron boosters (n = 9 before booster, n=5 in WT × 3, n = 4 in WT × 2 + Omicron).
Titer ratios were indicated in each graph and fold change described in manuscript is calculated from (ratio - 1). Data on dot-bar plots are shown as mean ± s.e.m. with individual data points in plots. Two-way ANOVA with Tukey’s multiple comparisons test was used to assess statistical significance. Statistical significance labels: * p < 0.05; ** p < 0.01; *** p < 0.001; **** p < 0.0001. Non-significant comparisons are not shown, unless otherwise noted as n.s., not significant.
