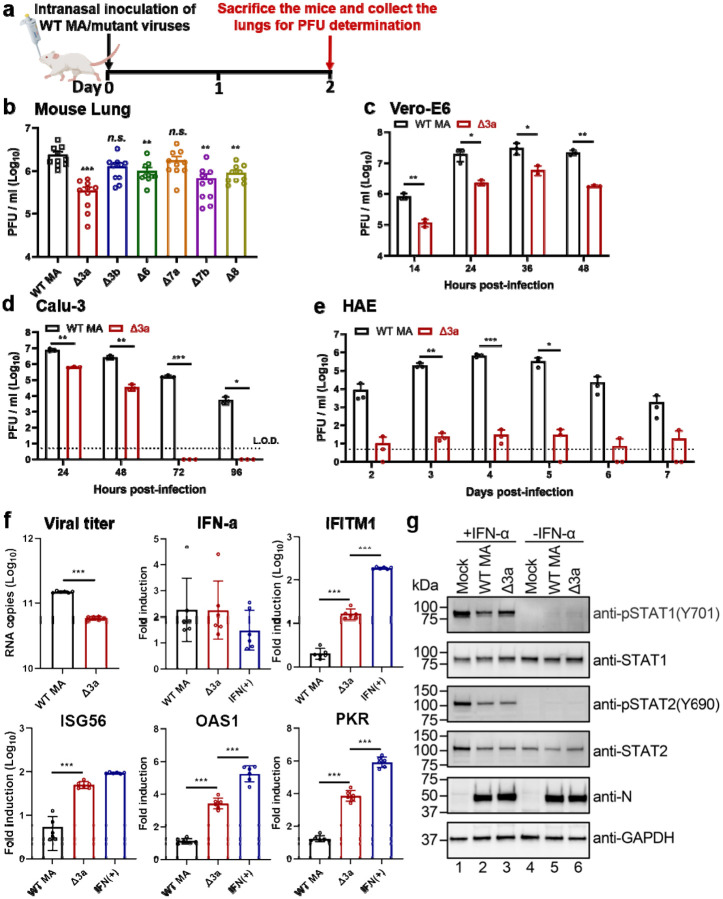
Figure 5. ORF3a deletion is mainly responsible for the attenuation of Δ3678 virus through interfering with STAT1 phosphorylation during type-I interferon signaling.
a,b, Analysis of individual ORFs in BALB/c mice. a, Experimental design. A mouse-adapted SARS-CoV-2 (MA) was used to construct individual ORF-deletion viruses. BALB/c mice were intranasally infected with 104 PFU of WT and individual OFR deletion viruses (n=10 per virus) and quantified for lung viral loads on day 2 post-infection. b, Lung viral loads from mice infected with different ORF deletion viruses. Dots represent individual animals (n=10). The mean ± standard error of mean is presented. A non-parametric two-tailed Mann-Whitney test was used to determine the statistical difference between the WT and ORF deletion groups. P values were adjusted using the Bonferroni correction to account for multiple comparisons. Differences were considered significant if p<0.0083. *, P<0.0083; **, P<0.0017; ***, P<0.00017. c-e, Replication kinetics of Δ3a virus in Vero-E6 (c), Calu-3 (d), and HAE (e) cells. The WT-MA and Δ3a were inoculated onto Vero-E6, Calu-3 and HAE cells at an MOI of 0.01, 0.1, and 2, respectively. After 2 h of incubation, the cells were washed three times with DPBS, continuously cultured with fresh 2% FBS DMEM, and quantified for infectious viruses in culture fluids at indicated time points. Dots represent individual biological replicates (n=3). The values represent the mean ± standard deviation. An unpaired two-tailed t test was used to determine significant differences *, P<0.05; **, P<0.01; ***, P<0.001. f, ORF3a deletion increases ISG expression in Δ3a-infected A549-hACE2 cells. A549-hACE2 cells were infected with WT or Δ3a virus at an MOI of 1 for 1 h, after which the cells were washed twice with DPBS and continuously cultured in fresh medium. Intracellular RNAs were harvested at 24 h post-infection. Viral RNA copies and mRNA levels of IFN-α, IFITM1, ISG56, OAS1, PKR, and GAPDH were measured by RT-qPCR. The housekeeping gene GAPDH was used to normalize the ISG mRNA levels. The mRNA levels are presented as fold induction over mock samples. As a positive control, uninfected cells were treated with 1,000 units/ml IFN-α for 24 h. Dots represent individual biological replicates (n=6). The data represent the mean ± standard deviation. An unpaired two-tailed t test was used to determine significant differences between Δ3a and WT-MA or IFN(+) groups. P values were adjusted using the Bonferroni correction to account for multiple comparisons. *, P<0.025; **, P<0.005; ***, P<0.0005. g, ORF3a suppresses type-I interferon by reducing STAT1 phosphorylation. A549-hACE2 cells were pre-treated with or without 1,000 units/ml IFN-α for 6 h. The cells were then infected with WT-MA or Δ3a virus at an MOI of 1 for 1 h. The infected cells were washed twice with DPBS, continuously cultured in fresh media with or without 1,000 units/ml IFN-α, and analyzed by Western blot at 24 h post-infection.

