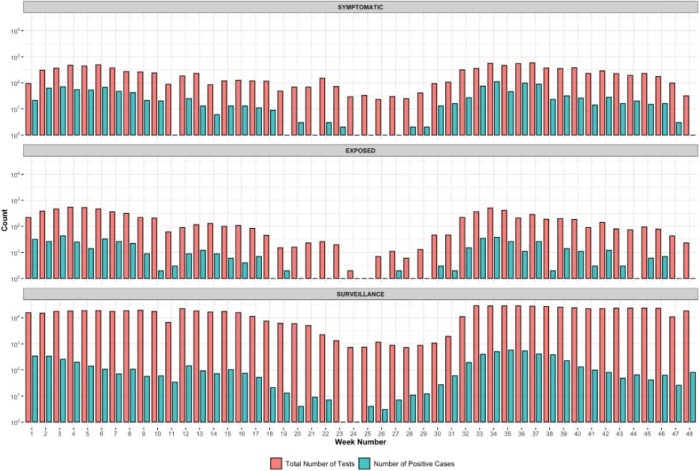
Fig 3: Number of tests and positive tests per category, by week.
Note that the y-axis is on a log10 scale. Samples are labeled “symptomatic” if the patient reports symptoms at the time of testing, or labeled “exposed” if they report exposure to a positive patient. Surveillance samples represent the rest of the samples collected. The lower case load during week 11 is due to the university’s spring break, and weeks 18–29 account for summer break.

