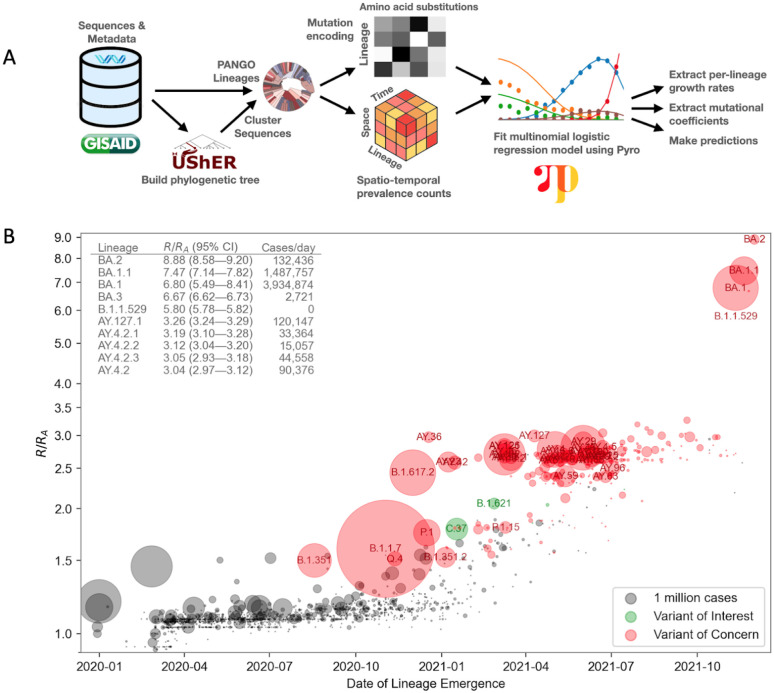
Figure 1.
A. Overview of the PyR0 analysis pipeline. After clustering UShER’s mutation annotated tree, sequence data are used to construct spatio-temporal lineage prevalence counts ytpc and amino acid substitution covariates Xcf. Pyro is used to fit a Bayesian multivariate logistic multinomial regression model to ytpc and Xcf.
B. Relative fitness versus date of lineage emergence. Circle size is proportional to cumulative case count inferred from lineage proportion estimates and confirmed case counts. Inset table lists the 10 fittest lineages inferred by the model. R/RA is the fold increase in relative fitness over the Wuhan (A) lineage, assuming a fixed generation time of 5.5 days.

