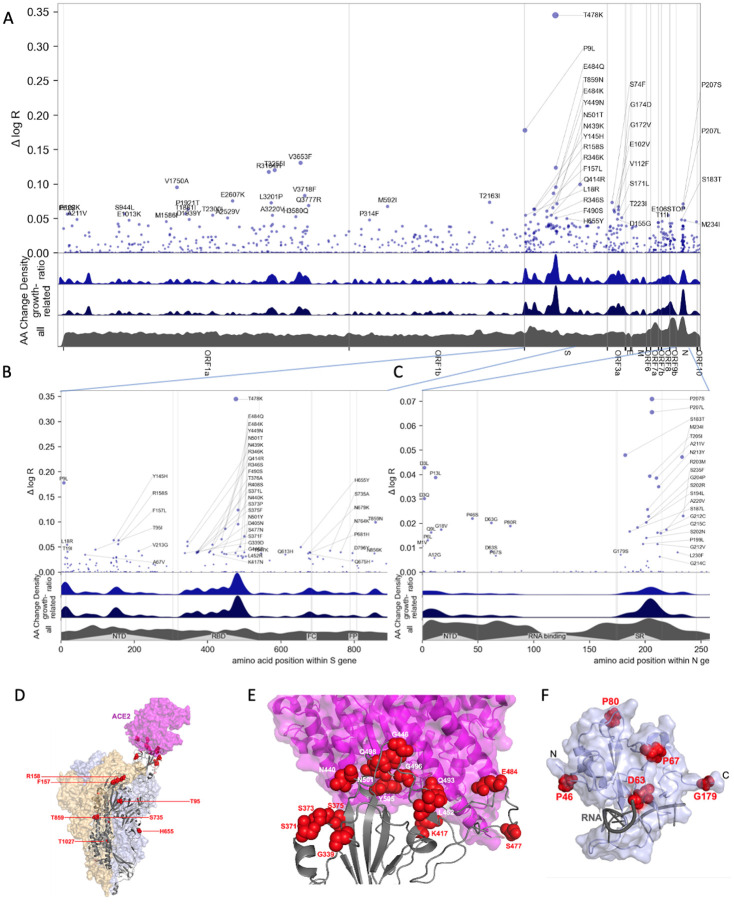
Figure 3.
Manhattan plot of amino acid changes assessed in this study. A. Changes across the entire genome. B. Changes in the first 850 amino acids of S. In each of A-C the y axis shows effect size Δ log R, the estimated change in log relative fitness due to each amino acid change. The bottom three axes show the background density of all observed amino acid changes, the density of those associated with growth (weighted by |Δ log R|), and the ratio of the two. The top 55 amino acid changes are labeled. See Figure S13 for detailed views of S, N, ORF1a, and ORF1b. C. Changes in the first 250 amino acids of N. D. Structure of the spike-ACE2 complex (PDB: 7KNB). Spike subunits colored light blue, light orange, and gray. Top-ranked mutations are shown as red spheres. ACE2 is shown in magenta. E. Close-up view of the RBD interface. F. Top-ranked mutations in the N-terminal RNA-binding domain of N. Residues 44–180 of N (PDB: 7ACT) are shown in light blue. Amino acid positions corresponding to top mutations in this region are shown as red spheres. A 10-nt bound RNA is shown in gray.

