Figure 2.
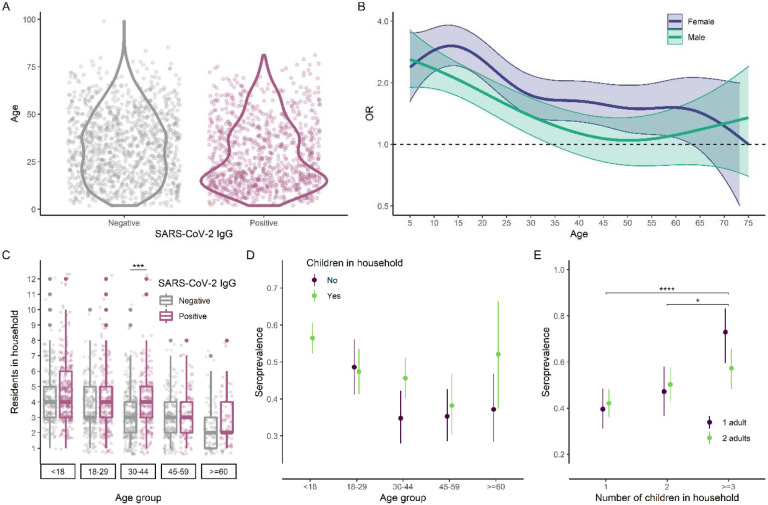
Seroprevalence among children and in their households. A: Age distribution of SARS-CoV-2 seronegative (median 33, interquartile range [IQR] 19–46) and seropositive (median 24 years, IQR 14.0–41) individuals. B: Odds ratio (OR) for SARS-CoV-2 seropositivity and 95% confidence interval (CI) associated with age, as estimated using a generalized additive model. C: Distribution of household size by age among SARS-CoV-2 seronegative and seropositive individuals. Seropositive individuals tended to be in larger households compared to seronegative individuals in the same age group. D: OR and 95% CI stratified by age group and presence of children in the household. E: Variation in seroprevalence among children by household composition (number of children and number of adults). The number of other children in the household was associated with higher seroprevalence, but there was no statistically significant difference between households with one adult and those with two adults. Asterisks indicate statistically significant differences (Bonferroni-adjusted p<0.05: *; <0.01: **; <0.001: ***).

