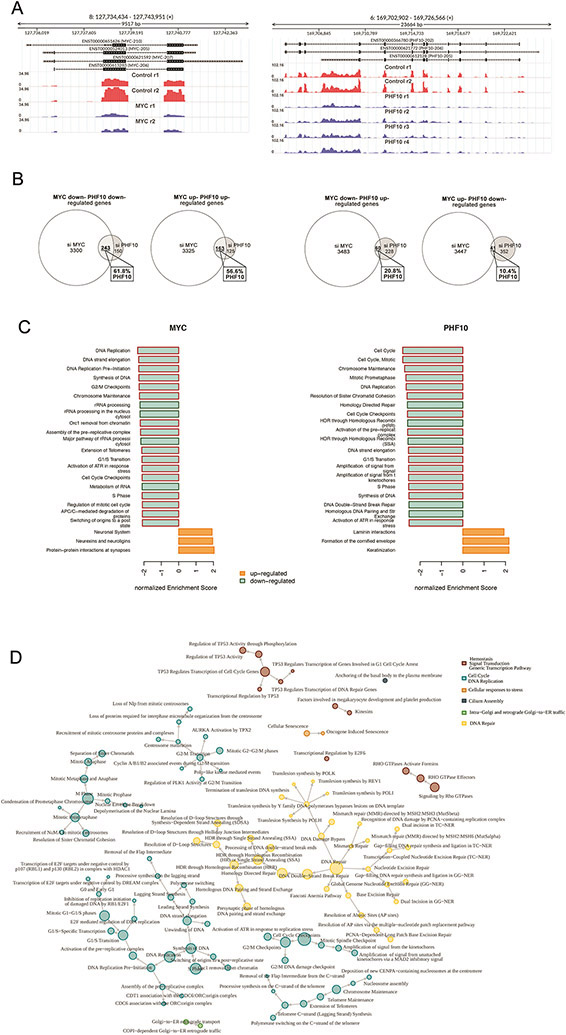
Figure 6. Depletion of PHF10 or MYC induces similar changes in global gene expression.
(A) MYC and PHF10 expression in A375 cells was down-regulated as verified by subsequent RNA-seq. Distribution of RNA-Seq reads over the MYC and the PHF10 genes are shown in red (controls) and blue (knockdown) replicas. Y axis: RPKM normalized expression. (B) Venn’s diagrams of genes down- and up-regulated upon depletion of MYC or PHF10 revealed by RNA-Seq. (C) Top-20 enriched Reactome pathways (sorted by normalized enrichment score) for MYC- and PHF10-dependent genes according to GSEA. Red frames indicate pathways related to Cell Cycle in the Reactome pathways hierarchy. (D) Pathway interaction network for Reactome pathways enriched in intersected MYC/PHF10 down-regulated genes according to ORA analysis. The network was constructed using the Reactome pathway hierarchy. Pathways were clustered based on information about the parent’s nodes in the hierarchy.

