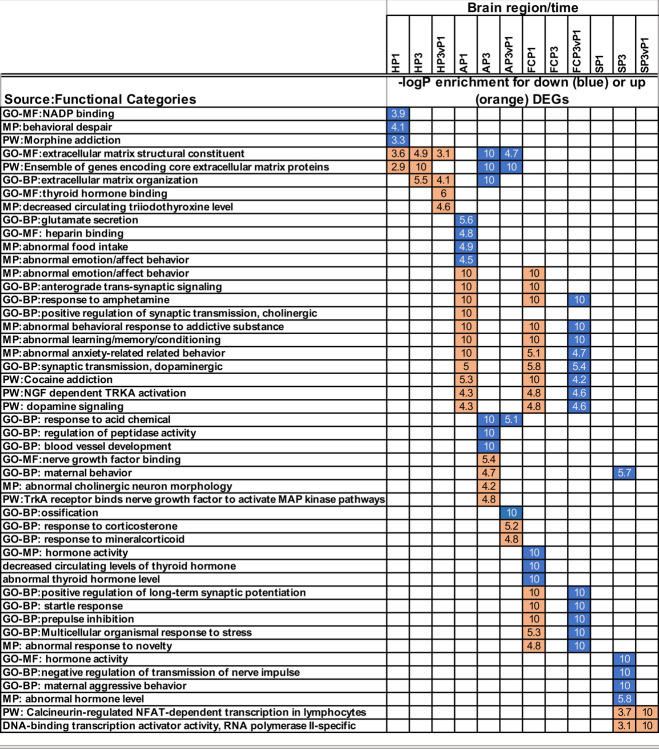
Fig 3. Enrichment of differentially expressed genes in functional categories.
Differentially expressed genes (identified at fdr ≤ 0.05 and with absolute value of fold change ≥1.5 in P1 vs E18, P3 Vs E18, and P3 vP1 comparisons, as described in Methods) were used to identify enriched functional categories using the ToppCluster tool (Kaimal et al., 2010), as described in Methods. Categories shown are a representative subset of the full report with all categories, p-values, and DEGs within enriched categories included in S3 Table. All reported categories were enriched with BH corrected p-value of ≤ 0.05; up- or down-regulation and category enrichment levels displayed as a heat map for simplicity. Colored cells denote up- (orange) or down-regulated (blue) Functional Categories in each brain region/time, with numbers denoting the calculated -log p values of enrichment. White squares denote that the category was not enriched in that DEG set.

