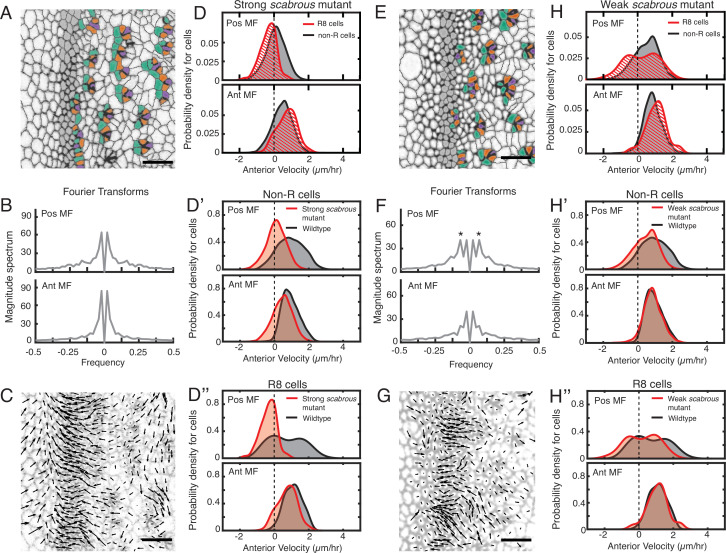
Figure 4. Scabrous is required for robust periodic cell flow in the MF.
(A-D’’) Analysis of scabrousBP2 eye disc with severe patterning defects. (A) Time point showing presumptive and fated R cells colored - R8 (purple), R2 and R5 (orange), R3 and R4 (cyan). (B) Cell velocities in the anterior direction were decomposed by Fourier transformation. Transformation was independently performed on cells binned by position relative to the MF, either on the posterior or anterior side of the MF. Velocities for all cells in each bin were collected over 5 hr. The peaks close to zero frequency correspond to the known equator-to-margin gradient in ommatidia maturation (Wolff and Ready, 1993). (C) A time point showing cell velocities. (D-D’’) Probability density of presumptive R8 (red) and non-R (black) cells with respect to their anterior velocity. Cells were binned by their position along the posterior or anterior sides of the MF, and cells were sampled over five hours. (D) Comparison of presumptive R8s and non-R cells in the scabrous mutant. (D’) Comparison of non-R cells from scabrous mutant and wildtype eyes. (D’’) Comparison of presumptive R8 cells from scabrous mutant and wildtype eyes. (E-H’’) Analysis of scabrousBP2 eye disc with mild patterning defects. (E) Time point showing presumptive R cells colored as in A. (F) Cell velocities in the anterior direction were decomposed by Fourier transformation. Transformation was independently performed on cells binned by their position along the posterior and anterior sides of the MF. Velocities for all cells in each bin were collected over 5 hr. Velocity oscillations of fixed spatial frequency (marked by asterisks) are weaker than in wildtype (compare to Figure 2B). (G) A time point showing cell velocities. (H-H’’) Probability density of presumptive R8 (red) and non-R (black) cells with respect to their anterior velocity. Cells were binned by their position along the posterior and anterior sides of the MF, and cells were sampled over 5 hr. (H) Comparison of presumptive R8s and non-R cells in the scabrous mutant. (H’) Comparison of non-R cells from scabrous mutant and wildtype eyes. (H’’) Comparison of presumptive R8 cells from scabrous mutant and wildtype eyes.


