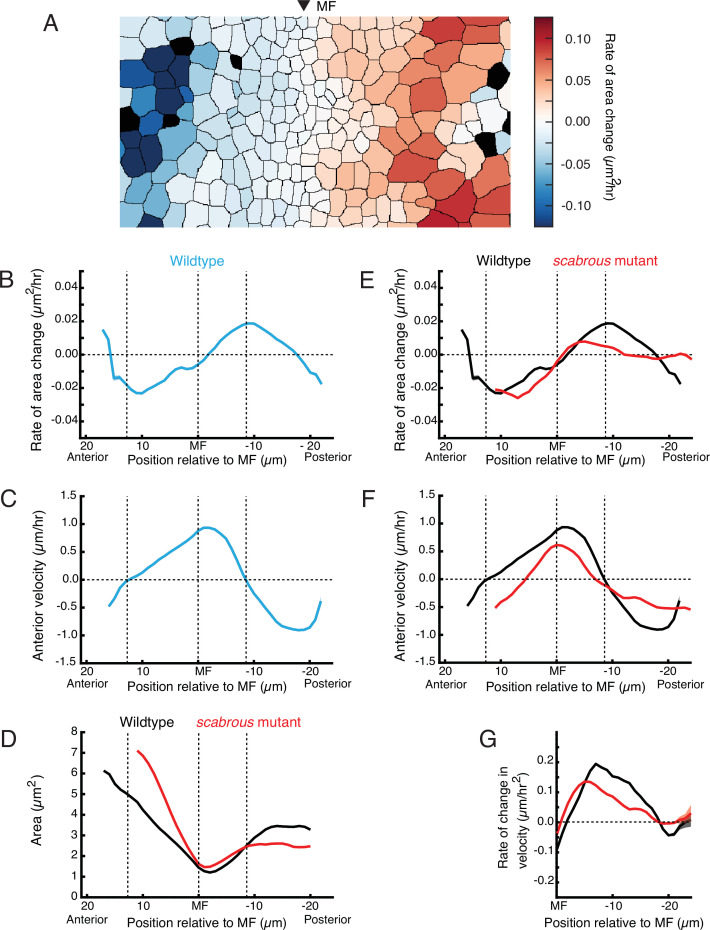
Figure 5. Scabrous is required for normal cell dilation and cell flow.
(A) The rate of area change for all cells in the field of view at a randomly chosen time point. A stripe of cells anterior to the MF shows rapid area contraction, while a stripe of cells posterior to the MF shows rapid area expansion. (B–G) Measurements of various cell features as a function of cell position along the anterior-posterior axis relative to the MF. The MF position is fixed at zero. Measured features were averaged across all cells along the dorsal-ventral axis and over 5 hr of imaging, giving a one-dimensional representation. Analysis of all discs was aggregated such that each moving line average shown is representative for multiple samples. Shading represents 95% confidence intervals. Note these features are highly stable throughout the time course of imaging and between samples. For B through F, dotted vertical lines denote the stable positions of inflection points in wildtype cell area change and direction of cell movement. (B) Rate of area change in wildtype cells. (C) Anterior velocity in wildtype cells. (D) Cell area in wildtype and scabrous mutant cells. (E) Rate of area change in wildtype and scabrous mutant cells. (F) Anterior velocity in wildtype cells and scabrous mutant cells. (G) Rate of velocity change in wildtype and scabrous mutant cells posterior to the MF.

