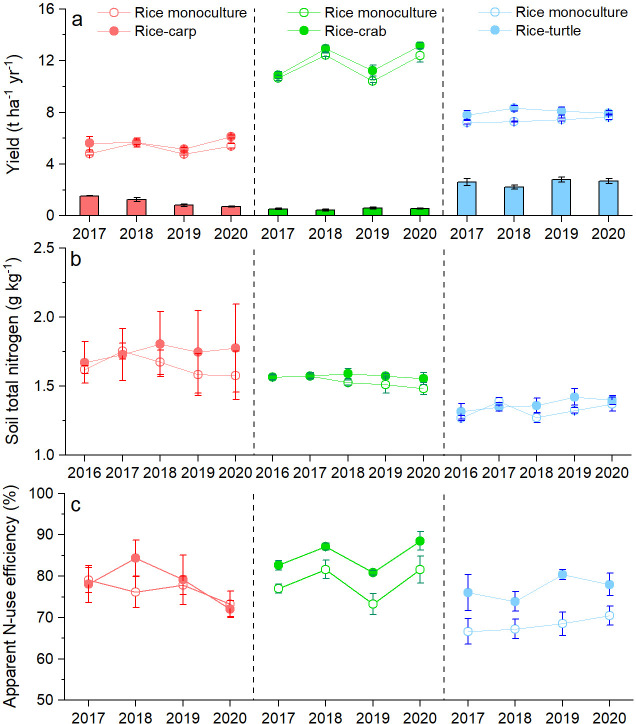
Figure 1. Yields of rice and aquatic animals (a), soil nitrogen content (b), and apparent N-use efficiency (c) in the field experiments.
In (a), rice yields are indicated by symbols and lines, and aquatic animal yields are indicated by bars. Values are means ± SE (n = 6).

