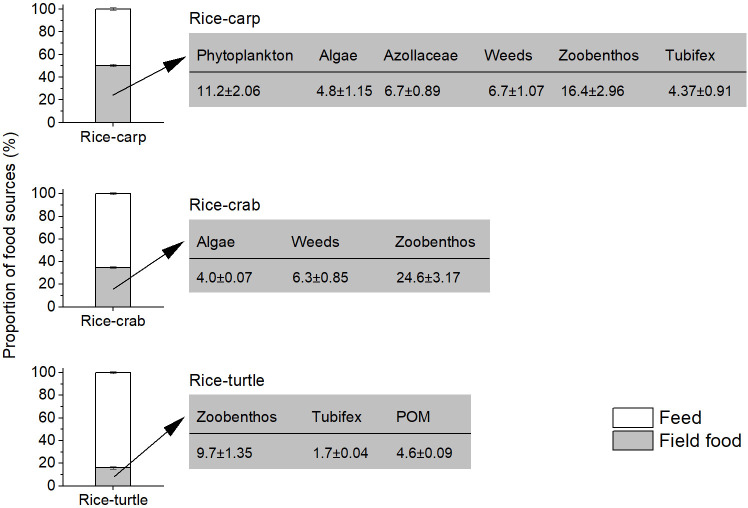
Figure 3. Diet components of aquatic animals as determined by dual stable isotopes (δ13C and δ15N), and the contribution of food sources to the aquatic animal diet in the field experiments.
In each of the three plots in the figure, the white zone represents the proportion of food that aquatic animals (i.e. carp, crabs, or turtles) obtained from feed, and the grey zone represents the percentage of food that aquatic animals obtained from the rice field. The values in the rectangles to the right indicate the rice field food components as percentages of the total food obtained by the aquatic animals. POM: particulate organic matter.

