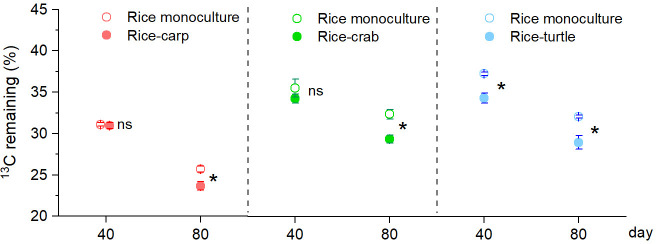
Figure 4. Organic matter decomposition in the field experiments at 40 and 80 days after the beginning (DAB) of the experiment.
A higher percentage of 13C remaining indicates slower decomposition. Values are means ± SE (n = 6). An asterisk indicates a significant difference between RM (rice monoculture) and RA (rice-aquatic animal coculture) at p < 0.05; ns indicates that the difference was not statistically significant.

