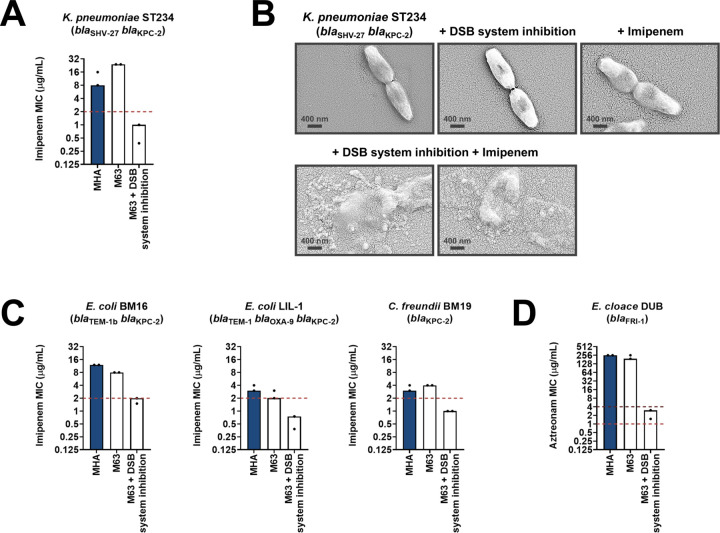
Figure 6. Chemical inhibition of the DSB system sensitizes multidrug-resistant clinical isolates to currently available β-lactam antibiotics.
(A) Addition of a small-molecule inhibitor of DsbB results in sensitization of a K. pneumoniae clinical isolate to imipenem. (B) Chemical inhibition of the DSB system in the presence of imipenem (final concentration of 6 μg/mL) results in drastic changes in cell morphology for the K. pneumoniae clinical isolate used in panel (A), while bacteria remain unaffected by single treatments (DSB inhibitor or imipenem). Images show representative scanning electron micrographs of untreated cells (top row, left), cells treated with the DSB inhibitor (top row, middle), cells treated with imipenem (top row, right), and cells treated with both the DSB inhibitor and imipenem (bottom row). Scale bars are at 400 nm. (C) Addition of a small-molecule inhibitor of DsbB results in sensitization of E. coli and C. freundii clinical isolates to imipenem. (D) Chemical inhibition of the DSB system of an E. cloacae clinical isolate harboring blaFRI-1 results in reduction of the aztreonam MIC value by over 180 µg/mL, resulting in intermediate resistance as defined by EUCAST. For panels (A), (C) and (D) graphs show MIC values (μg/ml) from two biological experiments, each conducted as a single technical repeat. MIC values determined using Mueller-Hinton agar (MHA) in accordance with the EUCAST guidelines (dark blue bars) are comparable to the values obtained using defined media (M63 agar, white bars); use of growth media lacking small-molecule oxidants is required for the DSB system inhibitor to be effective. Red dotted lines indicate the EUCAST clinical breakpoint for each antibiotic, and purple dotted lines indicate the EUCAST threshold for intermediate resistance.

