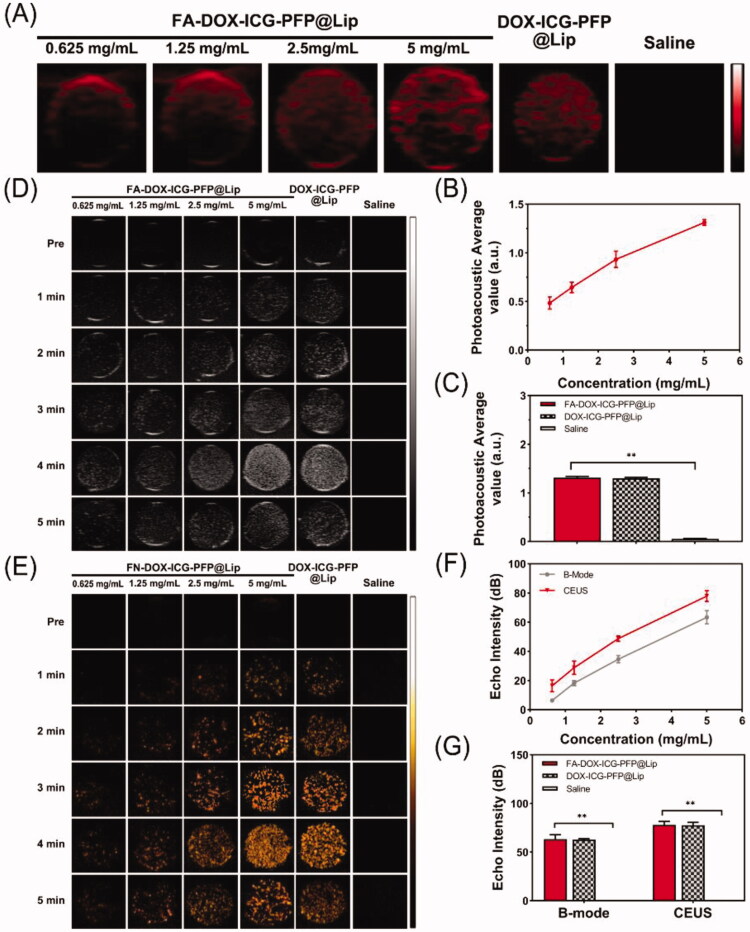
Figure 3.
In vitro dual-modal imaging. (A) Photoacoustic images of FA-DOX-ICG-PFP@Lip (0.625, 1.25, 2.5, and 5 mg/mL), DOX-ICG-PFP@Lip (5 mg/mL), and saline. (B) Photoacoustic values of FA-DOX-ICG-PFP@Lip (0.625, 1.25, 2.5, and 5 mg/mL). (C) Photoacoustic values of FA-DOX-ICG-PFP@Lip (5 mg/mL), DOX-ICG-PFP@Lip (5 mg/mL), and saline. (D) B-mode and (E) contrast-enhanced ultrasound images of FA-DOX-ICG-PFP@Lip (0.625, 1.25, 2.5, and 5 mg/mL), DOX-ICG-PFP@Lip (5 mg/mL), and saline with laser irradiation at 1 W/cm2 for 5 min. (F) Echo intensity of FA-DOX-ICG-PFP@Lip (0.625, 1.25, 2.5, and 5 mg/mL) in B-mode and contrast-enhanced ultrasound. (G) Echo intensities of FA-DOX-ICG-PFP@Lip (5 mg/mL), DOX-ICG-PFP@Lip (5 mg/mL), and saline (**p<.01).

