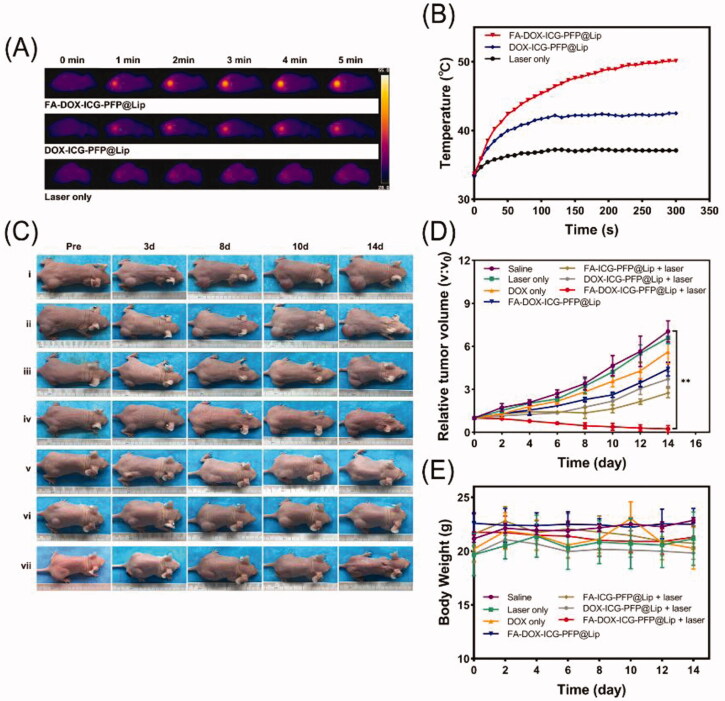
Figure 8.
In vivo anticancer therapy. (A) Thermal images of tumor-bearing mice 3 h after injection of FA-DOX-ICG-PFP@Lip, DOX-ICG-PFP@Lip, and saline under laser irradiation (1 W/cm2, 5 min). (B) Temperature–time curves of the three groups. (C) Photographs of Y79-tumor-bearing mice from seven groups during the 14-d period after different treatments (saline [i], laser only [ii], DOX only [iii], FA-DOX-ICG-PFP@Lip [iv], FA-ICG-PFP@Lip + laser [v], DOX-ICG-PFP@Lip + laser [vi], FA-DOX-ICG-PFP@Lip + laser [vii]). (D) Relative tumor–volume curves of different groups of Y79-tumor-bearing mice. (E) Body weights of mice measured during the 14-d period in different groups (**p<.01).

