Fig. 12.

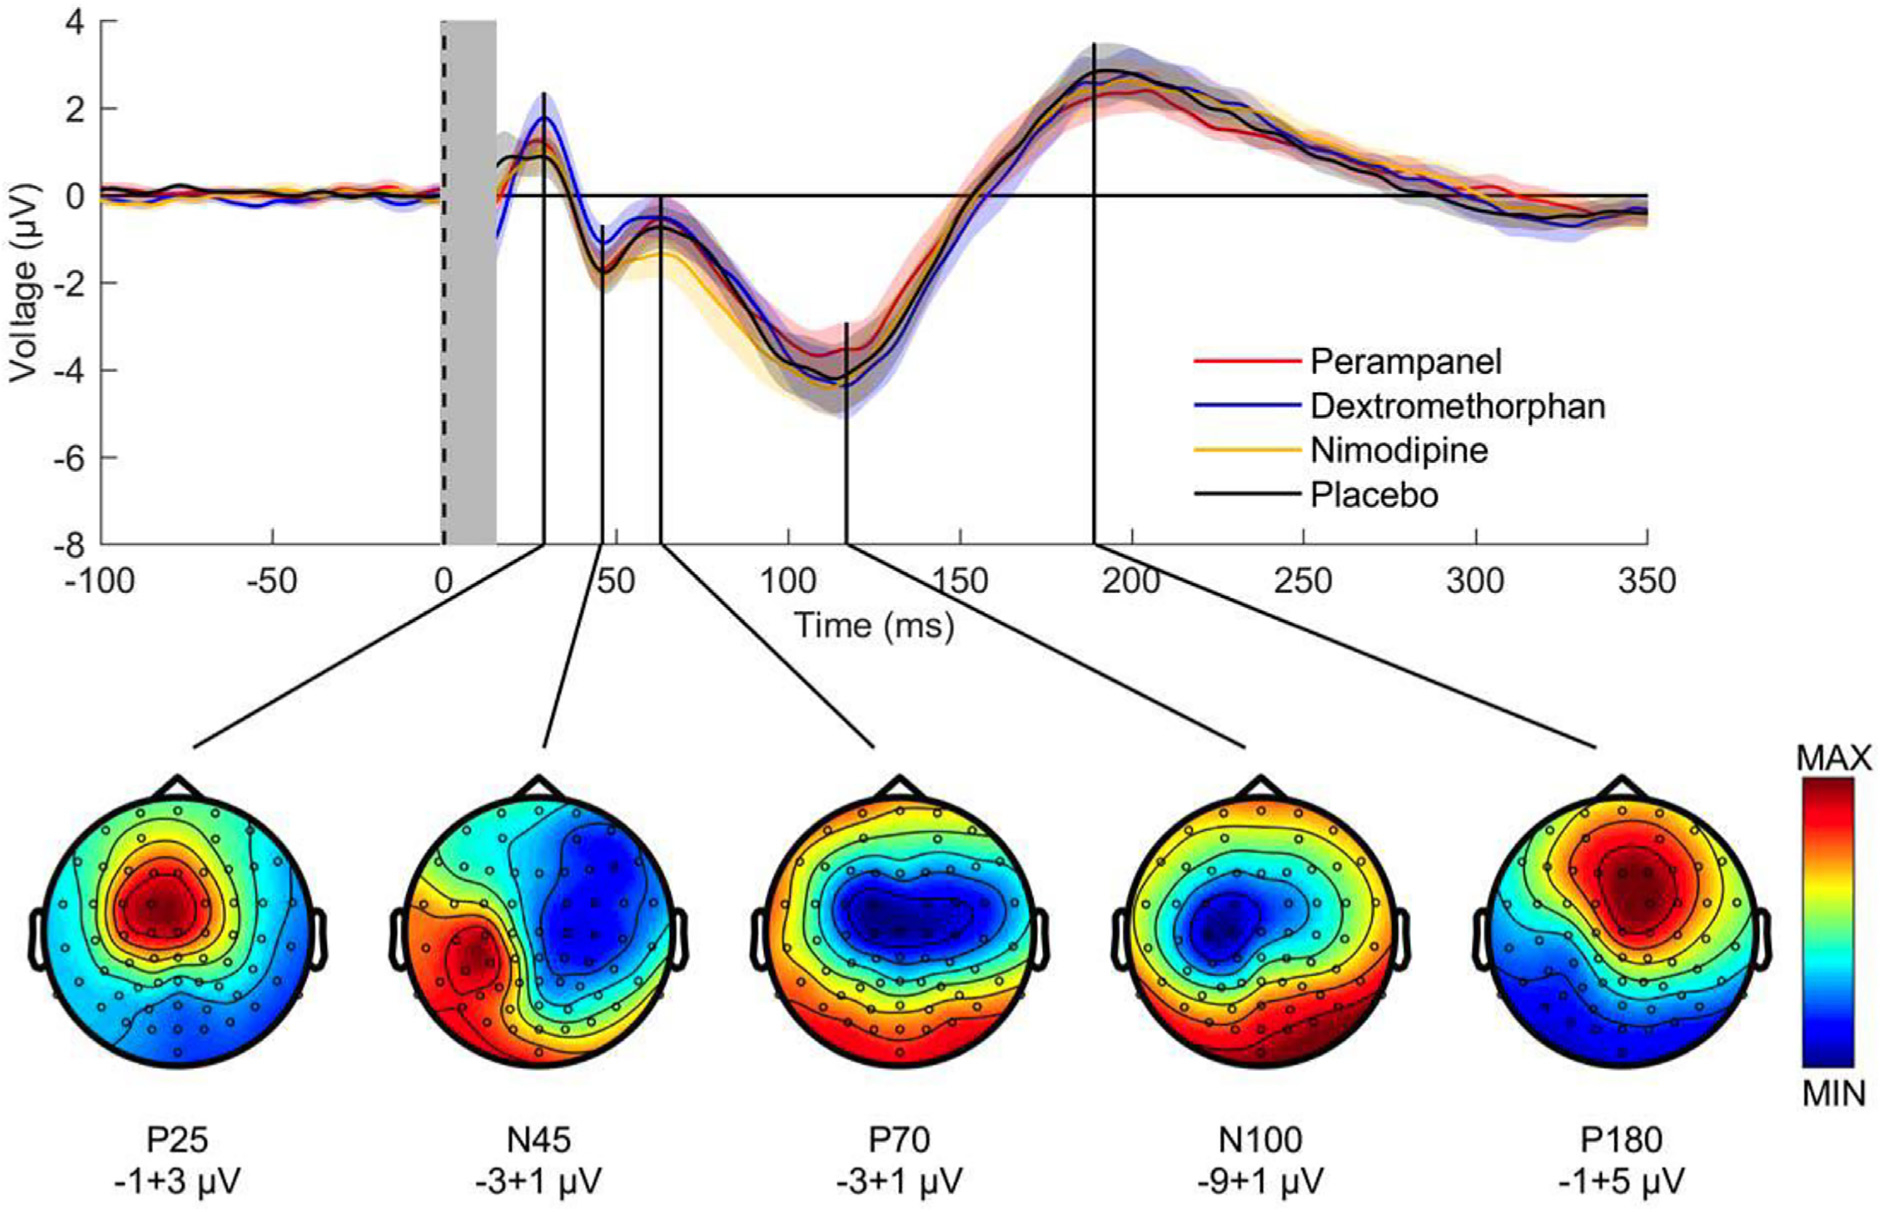
Group average of pre-drug TMS-evoked EEG potentials (TEPs) after stimulation of left motor cortex. Top panel: pre-drug TEPs averaged across all subjects (n = 16) and EEG electrodes for perampanel (red curve), dextromethorphan (blue curve), nimodipine (yellow curve) and placebo (black curve). Shades represent ± 1 SEM. The vertical gray bar represents the time window affected by the TMS artefact that was removed and interpolated. Note excellent reproducibility of TEPs at group level across baseline sessions. Bottom panel: pre-drug TEP topographies averaged across subjects (n = 16) and drug conditions. Each topography was obtained by averaging the signal in the respective time window of interest (P25: 16–34 ms, N45: 38–55 ms, P70: 56–82 ms, N100: 89–133 ms, P180: 173–262 ms). Data are voltages at sensor level (ranges indicated underneath the plots), while colors are normalized to maximum/minimum voltage (from (Belardinelli et al., 2021), with permission).
