
Fig. 15.
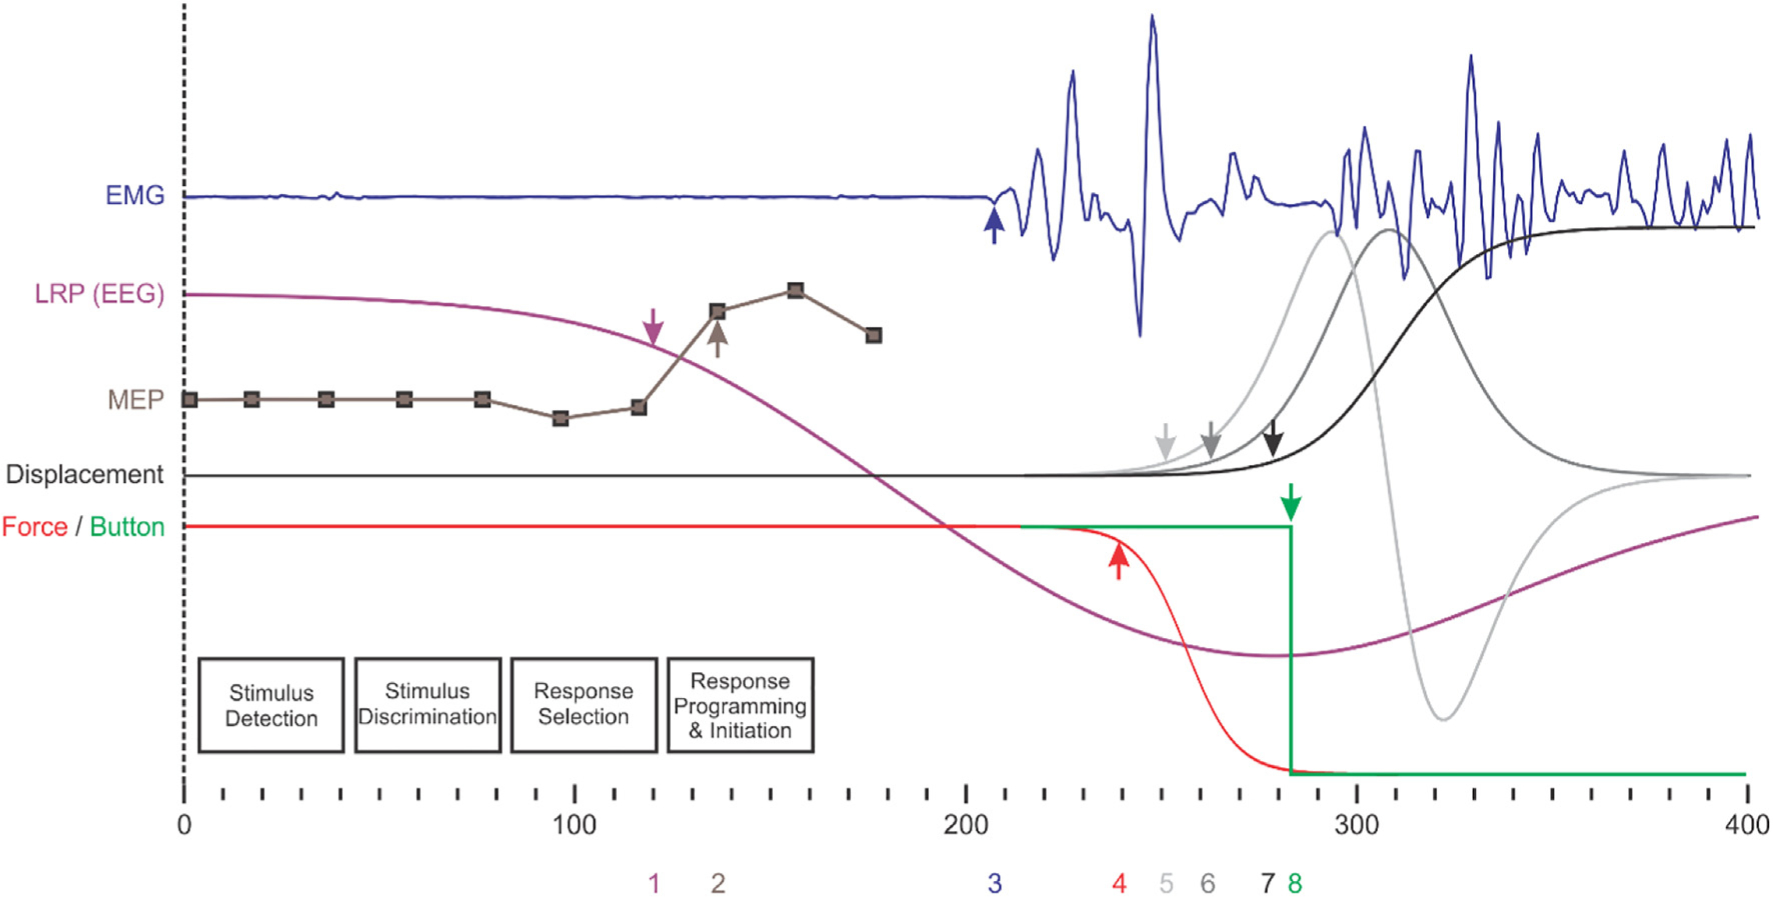
Schematic representation of different measures of reaction time (RT) in a single theoretical choice RT trial requiring a finger-lift off a button. Time zero indicates onset of the informative go-stimulus, with each theoretical signal shown with respect to its own baseline (offset vertically for visibility). Signals include electromyography (EMG) from the responding finger (blue), lateralized readiness potential (LRP) from electroencephalography (EEG) (purple), motor evoked potential (MEP) amplitude from motor cortex contralateral to responding limb (brown), displacement of the finger (black) - along with differentiated velocity and acceleration (dark grey, light grey), and force applied (red) with button state (green). Arrows on each trace (with corresponding numbers below the time scale) indicate the theoretical threshold-based time-detection of a change in that signal. For example premotor RT in EMG is shown with blue arrow and number 3. Durations of each information processing stage (black boxes) are not to scale, but note that onset of LRP roughly corresponds to completion of response selection (*Note that this theoretical representation of a single trial timeline is based on composite data from (Brenner and Smeets, 2019; Leocani et al., 2000; Leuthold et al., 2004; Maslovat et al., 2020)).