Figure 2.

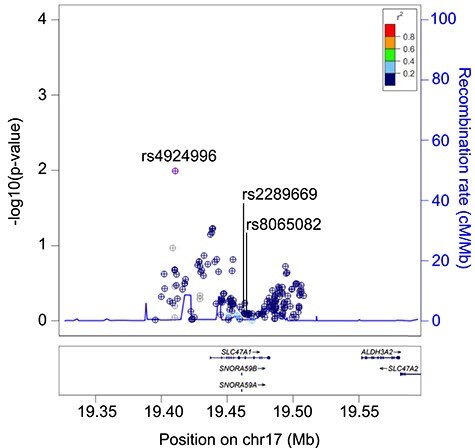
Regional association plots around the SLC47A1 locus. The plot shows locus-wise meta-analysis association between the SLC47A1 common variants and glycaemic response to metformin in the MetGen consortium dataset.

Regional association plots around the SLC47A1 locus. The plot shows locus-wise meta-analysis association between the SLC47A1 common variants and glycaemic response to metformin in the MetGen consortium dataset.