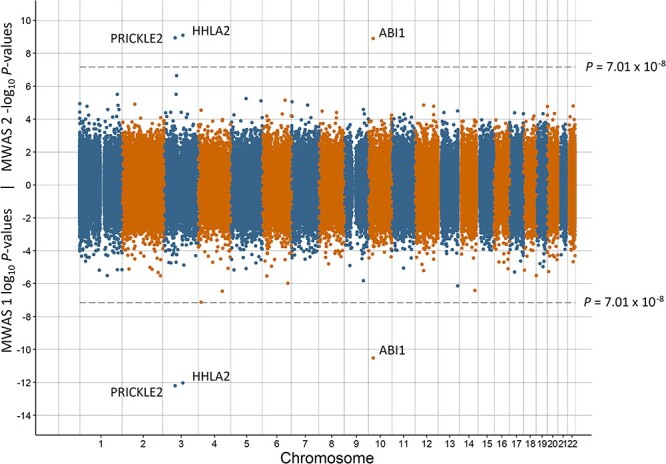
Figure 1.

Miami plot of the observed P-values of each CpG site for an association with preterm birth. Log10P-values are shown for MWAS 1 and −log10P-values are shown for MWAS 2. The dotted lines indicate methylome-wide significance (P = 7.01 × 10⁻⁸). The annotation of genes for significant sites is reported by missMethyl for MWAS 1 and by OSCA for MWAS 2.
