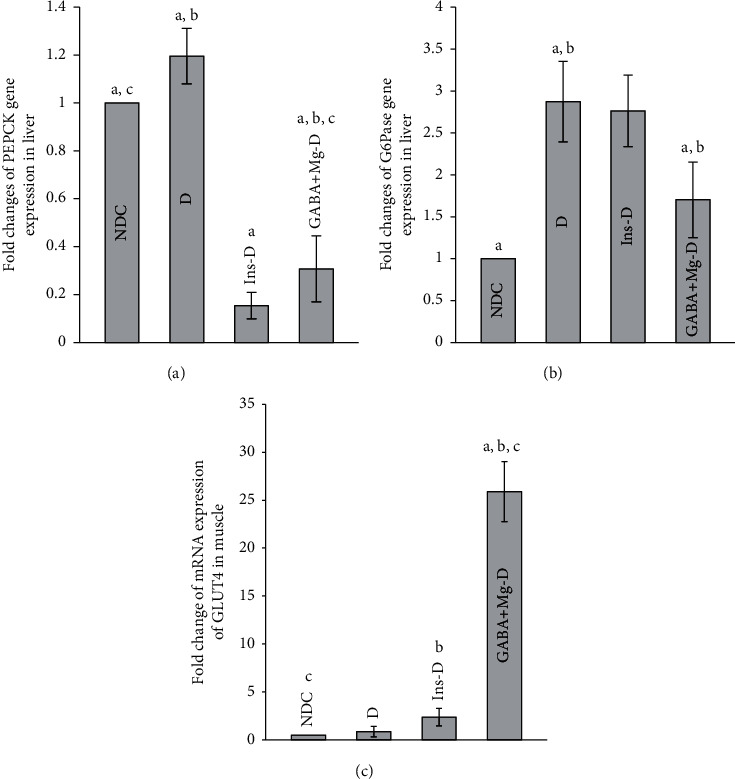
Figure 5.

Comparison of fold change in PEPKC mRNA expression. (a) G6pase, (b) mRNA expression of GLUT4, (c) the nondiabetic control group (NDC) was fed with a normal diet, the chronic diabetic group received high-fat diet and 35 mg/Kg STZ (D), diabetic animals treated with insulin (2.5 U/Kg two times per day) (Ins-D), and diabetic animals treated with GABA (1.5gr/kg) + MgSO4 (10 g/l add in drinking water) (GABA + Mg-D) (10 rats in each group. Data are expressed as mean ± SEM). (a) Significant difference between D and other groups (P < 0.01). (b) Significant difference between GABA + Mg-D and Ins-D group (P < 0.01). (c) Significant difference between NDC group and GABA + Mg-D (P < 0.01).
