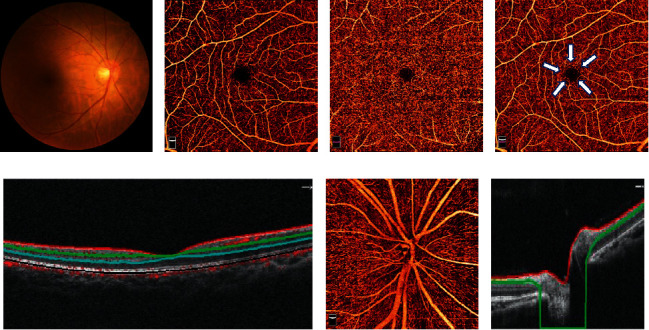
Figure 1.

Optical coherence tomography angiography (OCTA) assessments. (a) Color fundus photographs, (b) macular 6 × 6 mm OCTA image in the superficial vascular plexus (inner plexiform layer (ILM) - inner plexiform layer (IPL): area between the red and green lines in (E)), (c) macular 6 × 6 mm OCTA image in the deep vascular plexus (IPL - outer plexiform layer (OPL): area between the green and blue lines in (e)), (d) foveal avascular zone: white arrowhead, (e) a horizontal OCT B-scan of the retina, (f) optic nerve head (ONH) 4.5 × 4.5 mm OCTA image: area between the red and green lines in (g), and (g) a horizontal OCT B-scan of the ONH.
