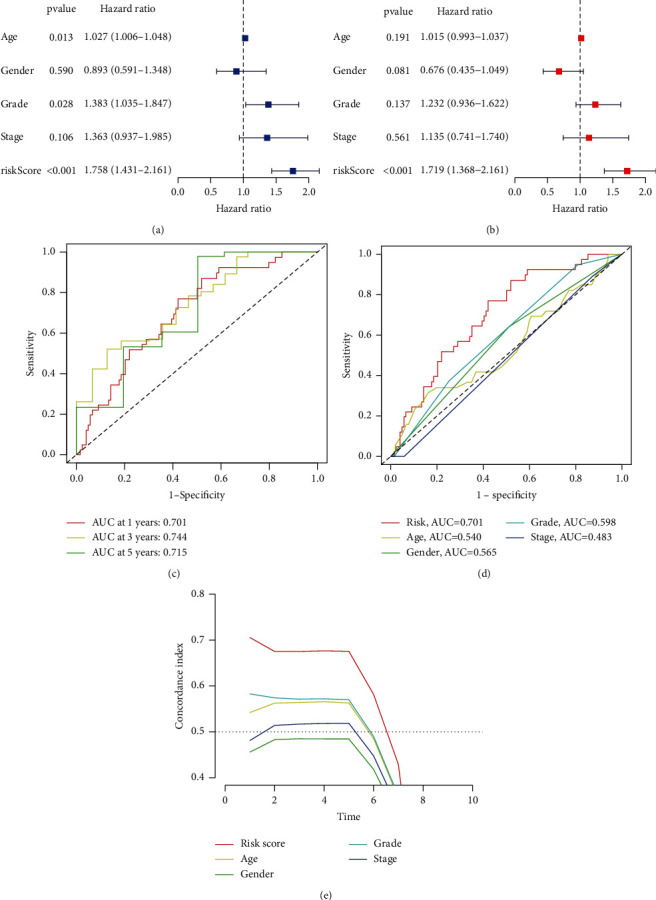
Figure 7.

Evaluation of the m5C-LS prognostic value in TCGA entire set. (a, b) Univariate and multivariate analyses of PC patients' OS. (c) ROC curves of 1-, 3-, and 5-year survival. (d) ROC curves of both clinical features and risk score. (e) Concordance indexes of both clinical features and risk score.
