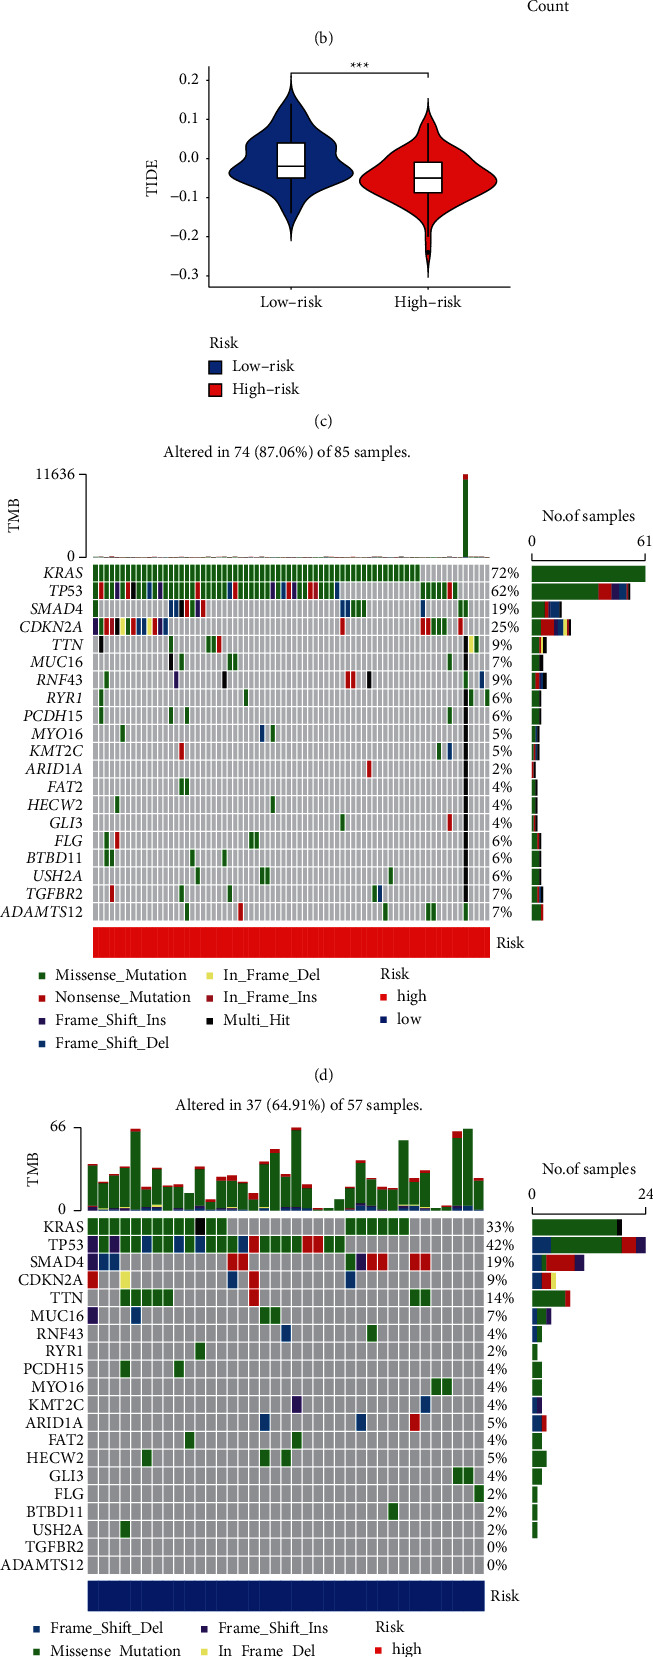
Figure 9.

Assessment of the immunotherapy reaction based on the m5C-LS in TCGA entire set. (a) Landscape of immune status between two groups. (b) GO enrichment analysis. (c) Difference of TIDE between two groups. (d, e) Waterfall plot of mutation values in the (d) high-m5C-LS group and (e) low-m5C-LS group. (f) Comparison of TMB between two groups. (g) K-M analysis based on the TMB. (h) K-M analysis combining TMB and the risk signature. ∗p < 0.05, ∗∗p < 0.01, and ∗∗∗p < 0.001.
