
Figure 7.
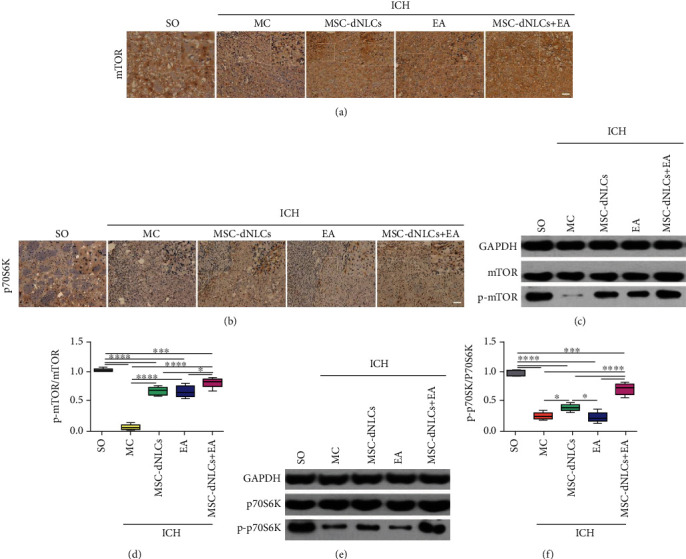
The levels of total and phosphorylated mTOR and p70S6K proteins in different groups. (a, b) Representative images of mTOR (a) and p70S6K (b) immunohistochemistry in the ipsilateral striatum of brain tissues from different groups. Scale bar = 100 μm. (c, d) Representative results (c) and quantitative analyses (d) of western blotting showed the level of the phosphorylated mTOR protein in different groups (n = 5 animals per group; ∗P < 0.05, ∗∗∗P < 0.001, and ∗∗∗∗P < 0.0001). (e, f) Representative results (e) and quantitative analyses (f) of western blotting showed the level of the phosphorylated p70S6K protein in different groups (n = 5 animals per group; ∗P < 0.05, ∗∗∗P < 0.001, and ∗∗∗∗P < 0.0001).