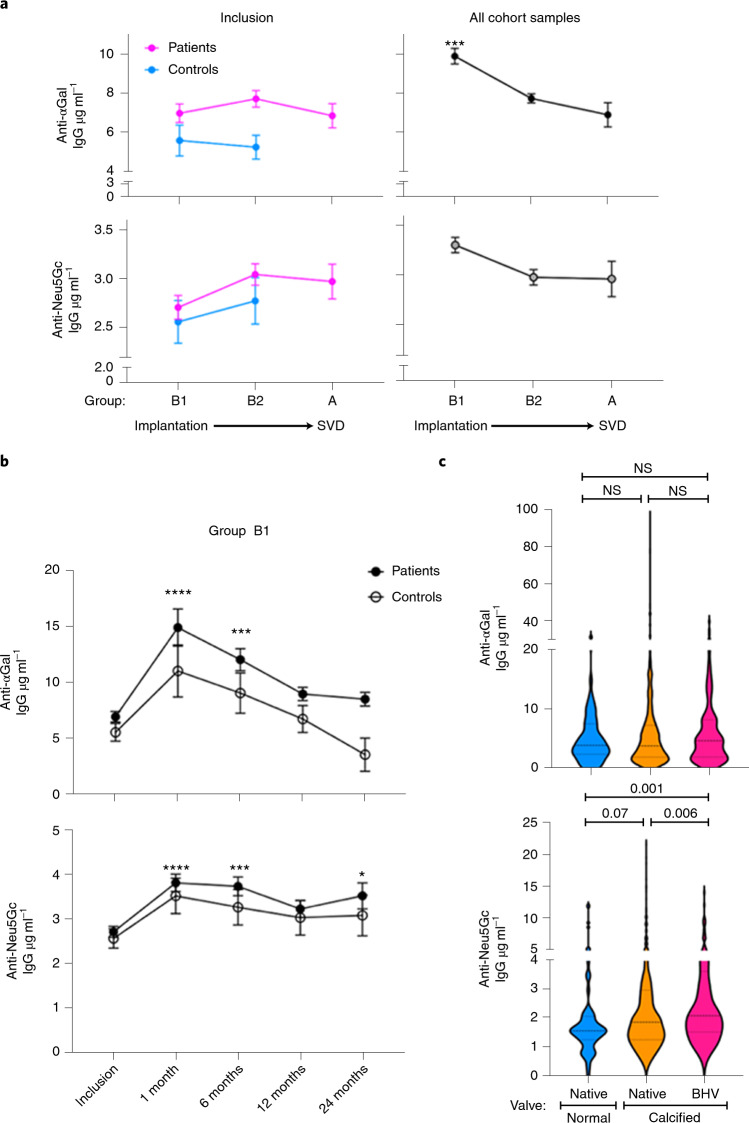
Fig. 2. Characteristics and kinetics of anti-αGal and anti-Neu5Gc IgG responses in the Translink cohort.
a, Anti-αGal and anti-Neu5Gc IgG levels, as measured by ELISA, in the B1, B2 and A groups at inclusion and for the full cohorts (mean ± s.e.m.; anti-αGal/Neu5Gc at inclusion: n = 604, 845, 144/605, 874, 170; in full cohort: n = 2,461, 2,344, 144/2,484, 1,860, 170, respectively in groups B1, B2 and A; Kruskal–Wallis test with Dunn’s multiple comparison test; ***P = 0.0004). b, Time course of anti-αGal and anti-Neu5Gc IgG in group B1 BHV patients versus controls (mean ± s.e.m.; anti-αGal n = 2,007/456 and anti-Neu5Gc n = 2,027/459 of BHV/controls, respectively; two-way ANOVA with Dunnett’s multiple comparisons test; anti-αGal, ****P < 0.0001, ***P = 0.0004; anti-Neu5Gc, ****P < 0.0001, ***P = 0.0002, *P = 0.019). c, Anti-αGal and anti-Neu5Gc IgG levels in patients with calcified native valves (n = 479; group B1 MHV/BHV candidate patients at inclusion) or patients with calcified BHVs (n = 170; group A patients at inclusion) compared to patients with normally functioning native valves (n = 59; group B1 patients with CABG; Kruskal–Wallis test followed by two-stage linear step-up procedure of Benjamini, Krieger and Yekutieli to correct for multiple comparisons by controlling the FDR < 0.05).

