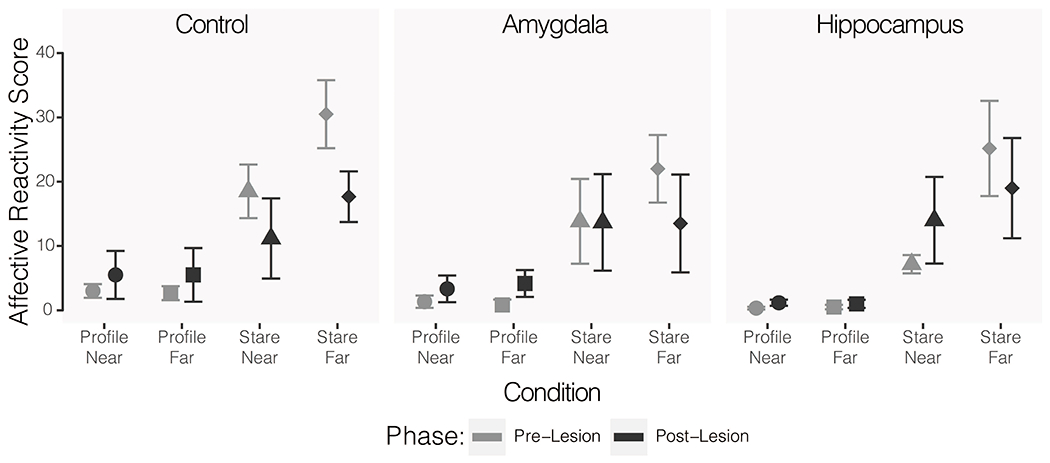
Figure 3.

Mean reactivity scores for across all Human Intruder Test conditions for each of the three groups. Lighter grey shapes indicate the pre-operative scores and darker grey shapes indicate the post-operative scores. Circles show reactivity in the profile-near condition, squares show profile-far, triangles show stare-near, and diamonds show stare-far. Error bars indicate SEM.
