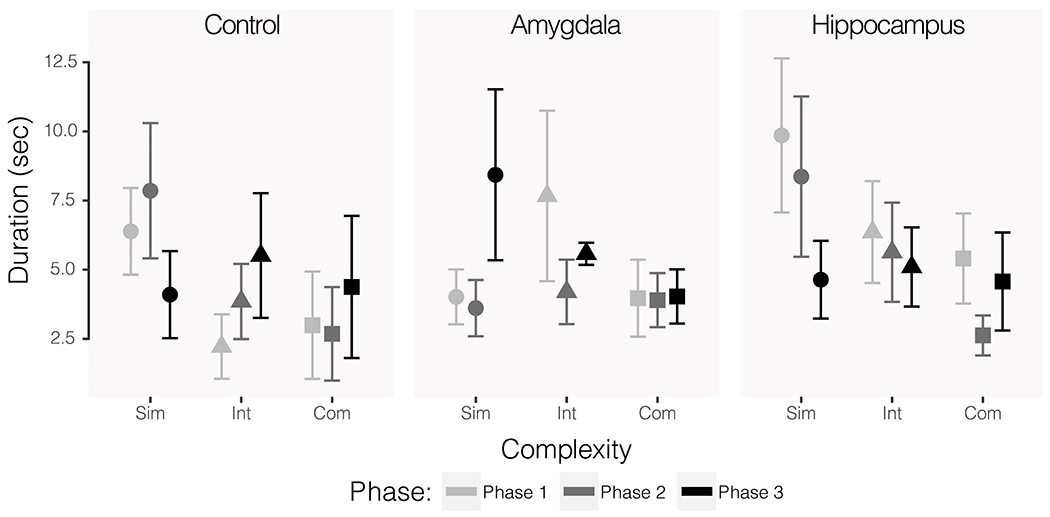
Figure 8.

Duration of time spent at the front of the cage during reptilian-like object trials only. All phases represent post-operative data and exposure to the same series of objects. The first iteration of testing (Phase 1) is shown in the lightest grey, the second (Phase 2) is shown in the second lightest grey, and the third (Phase 3) is shown in the darkest color. Circular data points show average responses across simple object trials, triangles show intermediate, and squares show complex. Error bars show SEM.
