Figure 1.

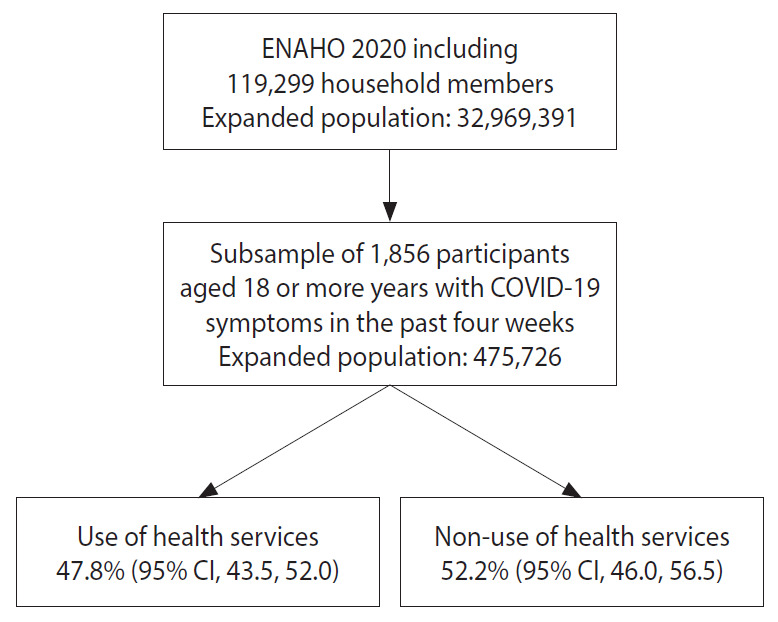
Flow chart of the participants included in the study. ENAHO, National Household Survey on Living Conditions and Poverty; COVID-19, coronavirus disease 2019; CI, confidence interval.

Flow chart of the participants included in the study. ENAHO, National Household Survey on Living Conditions and Poverty; COVID-19, coronavirus disease 2019; CI, confidence interval.