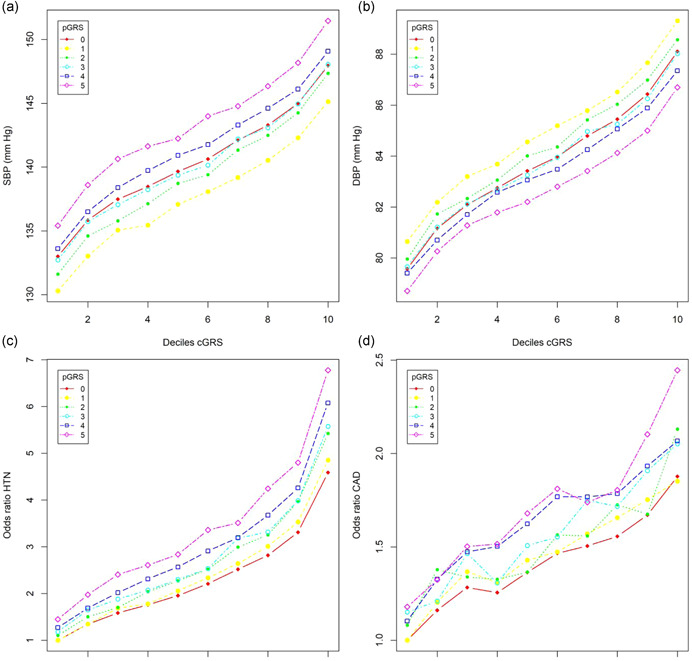
Figure 5.

Relationship the core genetic risk score (cGRS) and pleiotropic genetic risk score (pGRS) with blood pressure (BP), risk of hypertension (HTN), and cardiovascular disease (CVD) in UK Biobank. (a) Sex‐adjusted mean systolic BP (SBP); (b) sex‐adjusted mean diastolic BP (DBP); (c) odds ratios of HTN; (d) odds ratios of CVD. cGRS was calculated in every decile and pGRS was calculated in every quintile. Odds ratios were calculated by comparing each of the cGRS deciles and pGRS quintiles with the lowest decile and 20th. The curves with pGRS = 0 represent the models without including pGRS
