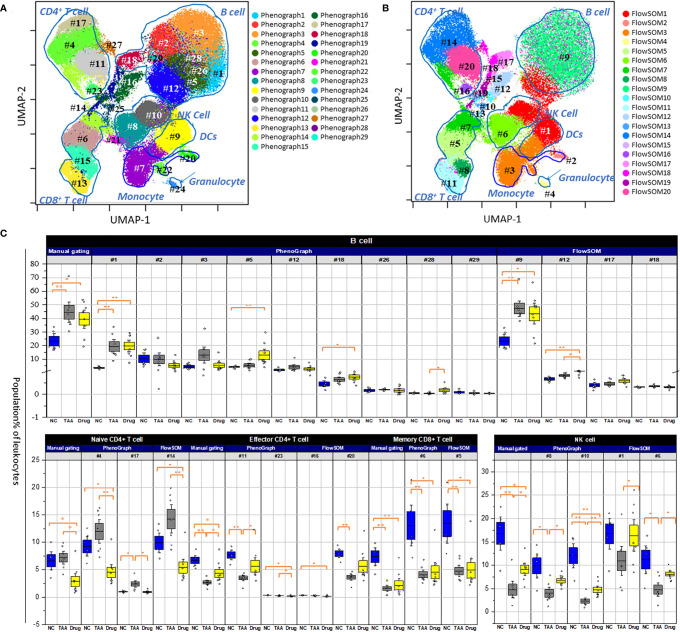
Figure 4.
Population abundance of manual gating. (A) PhenoGraph clusters analysis of manual gated leukocytes population. (B) FlowSOM clusters analysis of manual gated leukocytes population. Both overlaid on uniform manifold approximation and projection (UMAP). The numbering with # denoted individual population clusters. (C) Comparison of manually gated cell types for NC, TAA, and Drug groups represented in boxplots graph. The statistical significant differences considered 0.01 < p and < 0.05, 0.001 < p have been annotated as * and ** respectively.

