Figure 6.
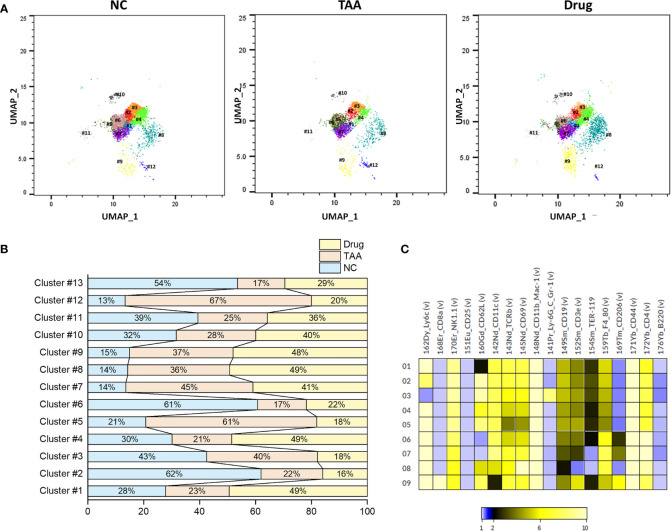
Phenograph sub-clusters of NK cells. (A) PhenoGraph cluster analysis of manual gated NK cells of NC, TAA, and Drug groups. (B) Population differences of NK cell sub-clusters represented in bar graph (%). (C) Intensity of surface marker expression of NK cells represented in heat map analysis.

