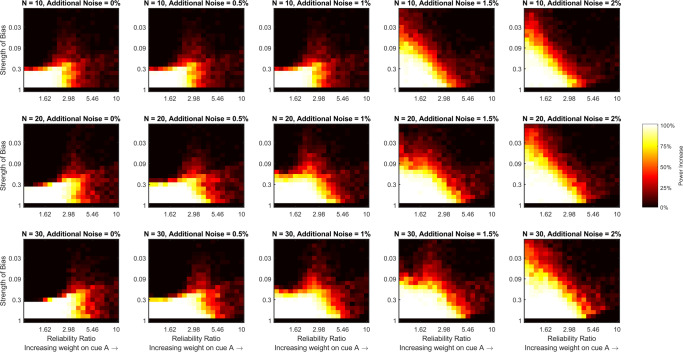
Fig. 4.
The increase in statistical power for detecting a combination effect gained by using the measure of sensory variability introduced here (that accounts for a central tendency bias) rather than, what we refer to as, a measure of behavioral variability (that does not account for a central tendency bias). Each panel of the figure is a heat map that shows how the increase in statistical power (estimated by subtracting the values depicted in Fig. 2 from those depicted in Fig. 3) varies with the ratio of the two cues’ reliabilities and the strength of the central bias for a fixed level of additional noise and a fixed sample size. The level of additional noise varies across the columns of the figure and sample size varies across rows

