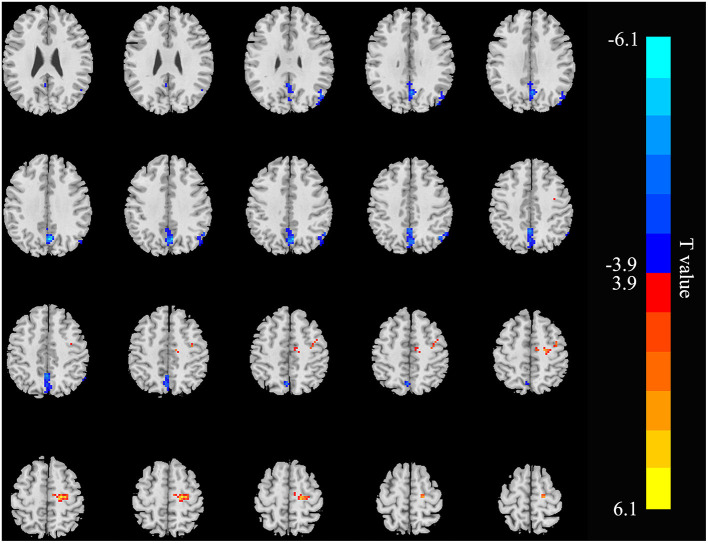
Figure 1.
Brain areas showing ALFF differences in the patients with end-stage renal disease (ESRD) relative to controls (p < 0.05, FDR corrected). Patients with ESRD showed significantly decreased ALFF values in the right angular gyrus and precuneus. But the right precentral gyrus showed increased ALFF values in patients with compared with controls. ALFF, amplitude of low-frequency fluctuation; ESRD, end-stage renal disease. The color bar represents t-values, which is obtained by the two-sample t-test. The reduced ALFF value is represented by a cool color, while the increased ALFF value is expressed in warm color.

