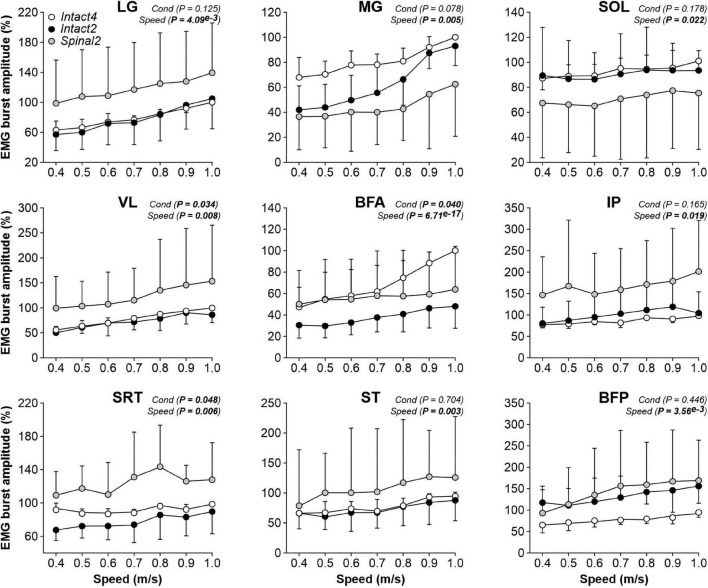
FIGURE 6.
Modulation of EMG burst amplitudes during quadrupedal or hindlimb-only locomotion in intact and spinal cats across speeds. The figure shows burst amplitudes from nine hindlimb muscles during Intact4, Intact2 and Spinal2 conditions at seven treadmill speeds. At each speed, 6–15 cycles were averaged per cat. For each cat, the mean obtained at a given speed in all three conditions was expressed as a percentage of the maximal value obtained in Intact4. Each data point indicates the mean ± SD for the group. P values comparing conditions (Cond) and speeds are indicated (main effects of repeated-measures ANOVA). For muscle abbreviations, see Figure 5 legend.

