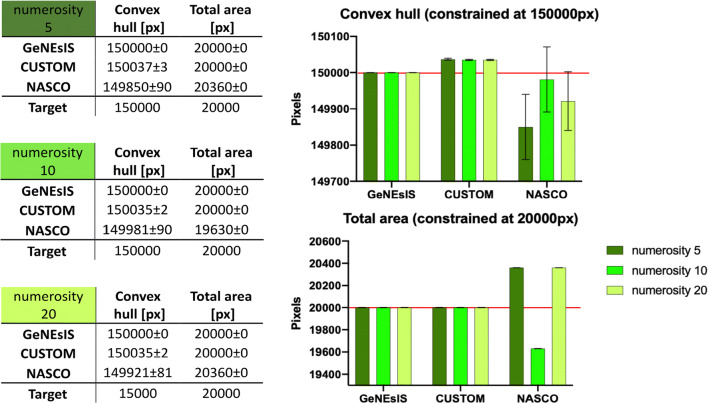
Fig. 5.
Comparison simulations between GeNEsIS and the most recent software (De Marco & Cutini, 2020; Guillaume et al., 2020). Three numerosities were generated (5, 10 and 20), with 100 images per numerosity. The aim was to fix the convex hull (at 150,000 px) and the total area (at 20,000 px) across numerosities. The tolerance was set at very low levels to test the fine precision of the software (0.0001% or the minimum possible). Means with relative standard errors for the controlled variables are reported in the tables and depicted in the bar graph as well for a direct comparison

