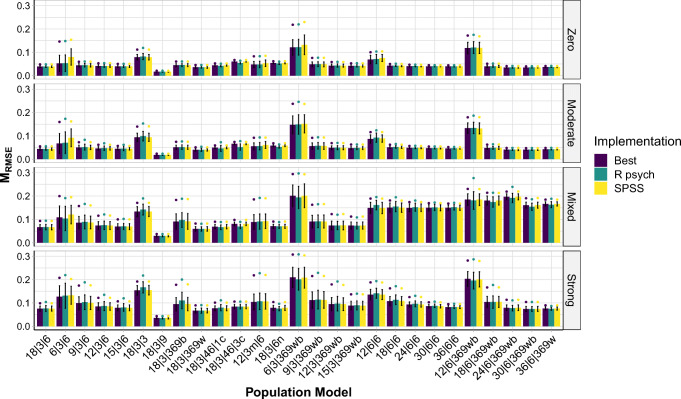
Fig. 2.
Distributions of RMSE of three different implementations, separately for the different population models, based on data sets simulated with N = 450. A population model is always a combination of a pattern matrix (on the x-axis) and a factor intercorrelation matrix (the facets). Bars indicate the mean RMSE, the whiskers indicate ± 1 SD, and dots represent the mean of the 5% largest RMSE. Best = implementation with best results overall; R psych = R psych implementation with SMC as initial communality estimates when no negative eigenvalues occurred and R psych implementation with unity as initial communality estimates when negative eigenvalues occurred; SPSS = SPSS implementation. See Table 2 for more information on these implementations. An overview of the population models is provided in Table 4. The detailed population pattern- and factor intercorrelation matrices are provided in the SM, Sections 5 and 6

