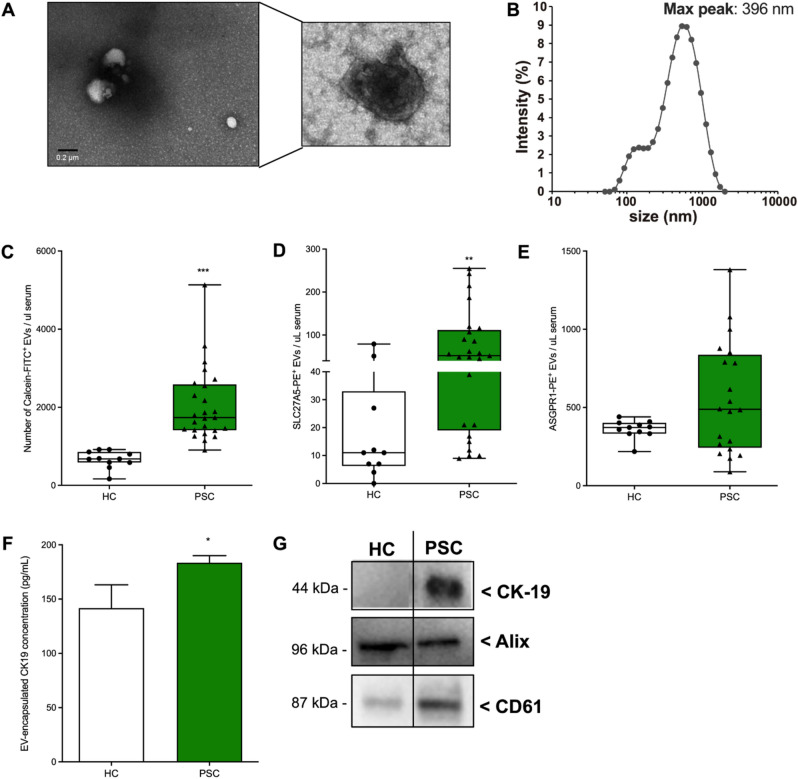
Figure 1.
Identification and characterization of circulating EVs in PSC patients. (A) Representative scanning electron microscopy images of circulating EVs isolated from PSC patients. (B) Dynamic light scattering analysis of the size31 of circulating PSC-derived circulating EVs (max peak: 396 nm). (C) Flow cytometry analysis of calcein/FITC + circulating EVs detected in healthy controls (n = 11) and PSC patients (n = 25). (D,E) Flow cytometry analysis of circulating EVs positive for hepatocyte markers SLC27A5 or ASGPR1. (F) Flow cytometry analysis of circulating EVs positive for cholangiocytes marker CK-19. (G) Western blot analysis of EV marker Alix and CD61 and cholangiocyte marker CK19 in healthy control and PSC-derived circulating EV protein lysates (samples derive from the same experiment and blots were processed in parallel). Values represent mean ± SD. Kruskal–Wallis test with post-hoc Mann–Whitney test and Bonferroni correction were used for statistical analysis.

