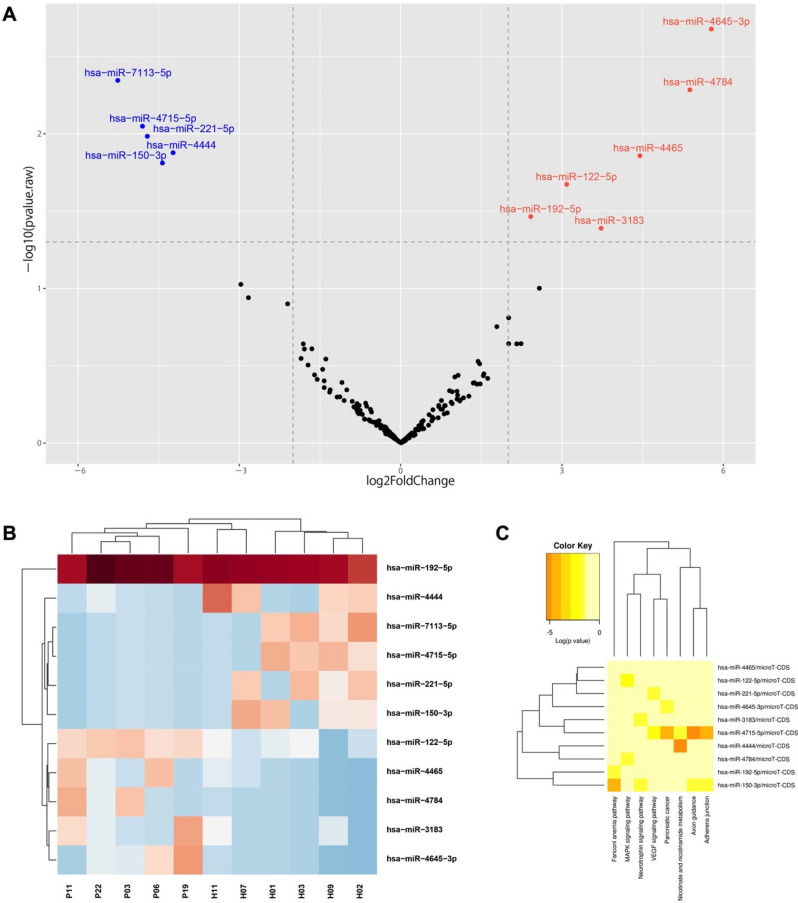
Figure 3.
Analysis of miRNA profile in EVs of PSC-derived circulating EVs. (A) Volcano plots illustrating significantly differentially abundant EV-miRNAs in PSC patients vs. healthy controls. The − log10 (adjusted p-value) is plotted against the log2 fold-change. (B) Unsupervised hierarchical clustering analysis of the top 11 differentially expressed circulating EV-miRNAs identified by miRNA-sequencing in PSC patients vs. healthy controls. An adjusted p-value of 0.05 was used to generate the heatmaps. The closer the color is to bright blue, the lower the expression while the closer the color is to bright red, the higher the expression. (C) KEGG pathway enrichment analysis of top 10 differentially expressed EV-miRNAs. KEGG is developed by Kanehisa Laboratories and a copyright request was approved for the use of this tool in this manuscript.

