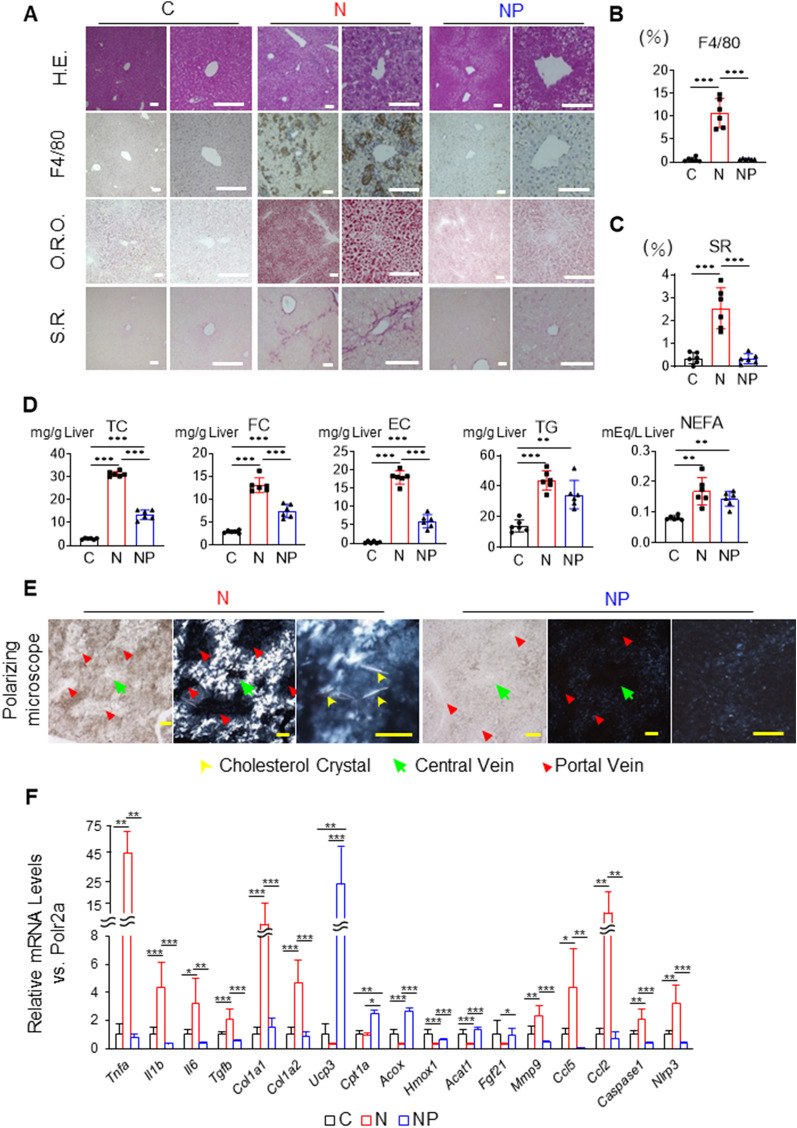
Figure 1.
Effects of the NASH diet and pemafibrate on the liver of wild-type male mice. (A) Histological examinations of samples from mice in the chow diet-fed group (C group), NASH diet-fed group (N group), and NASH diet + pemafibrate-fed group (NP group). (B) Percentage of examined area positive for F4/80. (C) Percentage of examined area positive for Sirius red. (D) Hepatic lipid contents by lipid extraction analysis. (E) Polarized microscope images of cholesterol crystals. The yellow, green, and red arrows indicate cholesterol crystals, central vein, and portal vein, respectively. (F) mRNA expression associated with inflammation, fibrosis, β-oxidation, chemokines, and inflammasomes. The mean value of the expression of the C group, obtained by correcting each CT value with the respective housekeeping gene, was used as a control (one) to indicate the relative expression. Scale bar: 100 µm. The results are presented as the mean ± SD, and p values were calculated using one-way ANOVA with Tukey’s post-hoc test. *P < 0.05, **P < 0.01 and ***P < 0.001, C vs. N group or C vs. NP group or N vs. NP group. The number of mice in each group: C, n = 6; N, n = 6; NP, n = 6. H.E., haematoxylin–eosin; O.R.O., oil red O; S.R., Sirius red; TC, total cholesterol; FC, free cholesterol; EC, esterified cholesterol; TG, triglycerides; NEFA, nonesterified fatty acids.

