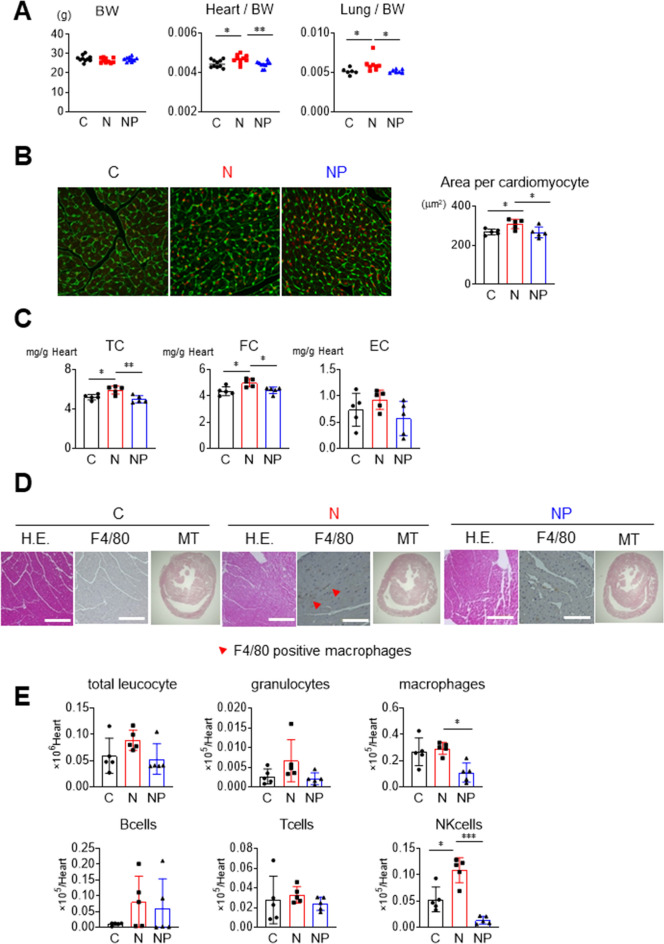
Figure 4.
Cardiac phenotypes and histological images. (A) Body weight, heart/body weight, and lung/body weight were measured. (B) Cardiac WGA staining was performed, and the mean area per cardiomyocyte was measured. (C) Cardiac cholesterol contents were measured. (D) Cardiac H.E., F4/80, and MT staining in each group. The red arrows indicate the infiltration sites of F4/80-positive macrophages. (E) Flow cytometry analysis of cells isolated from collagenase-treated hearts. Myocardial leukocyte fraction was measured. The results are presented as the mean ± SD, and p values were calculated using one-way ANOVA with Tukey’s post hoc test. *P < 0.05, **P < 0.01 and ***P < 0.001; C vs. N group or N vs. NP group. The number of mice in each group: C, n = 10 (A), n = 5 (B-E); N, n = 10 (A), n = 5 (B-E); NP, n = 10 (A), n = 5 (B-E). WGA, wheat germ agglutinin; EC, esterified cholesterol; H.E., haematoxylin–eosin; M.T., Masson's trichrome.

