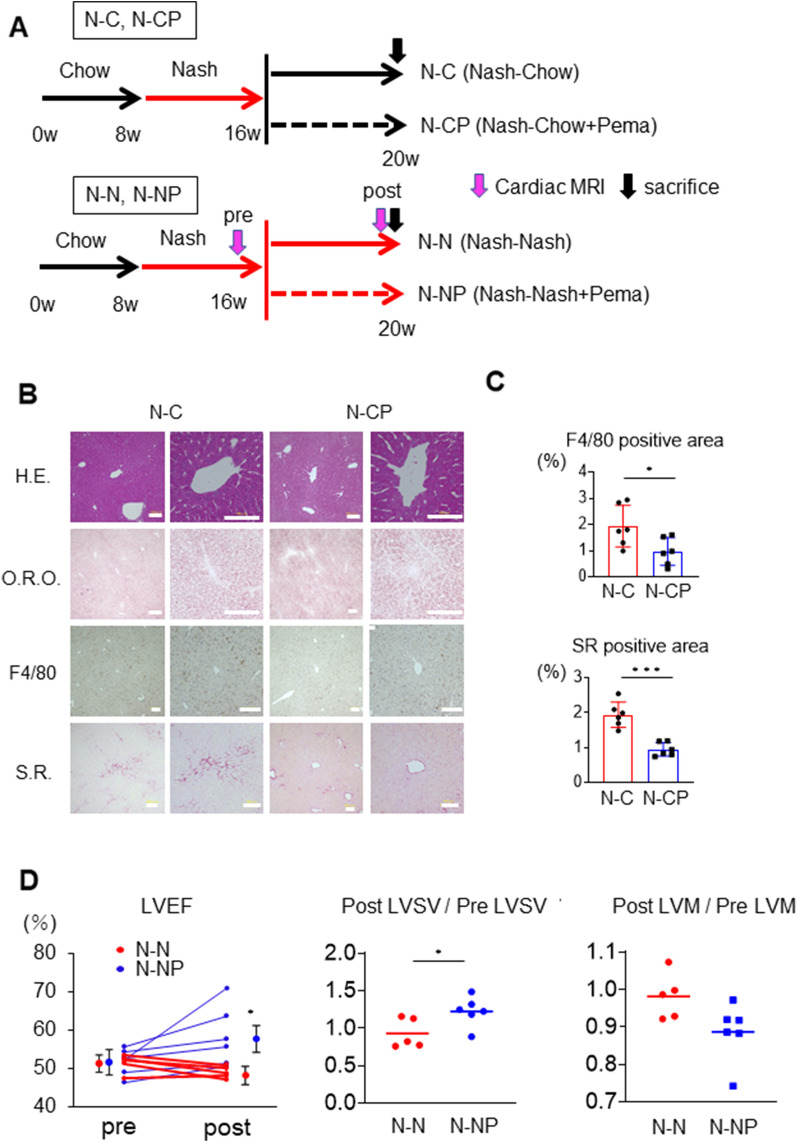
Figure 6.
Effect of pemafibrate after the development of steatohepatitis and cardiomyopathy. (A) Chow diet, chow diet + 0.1 mg/kg pemafibrate, NASH diet, or NASH diet + 0.1 mg/kg pemafibrate diet was fed to C57Bl6 male mice for 4 weeks after feeding the NASH diet for 8 weeks (N–C, N-CP, N–N, and N-NP groups, respectively). Cardiac MRI was performed before and after the additional diet in the N–N and N-NP groups. (B) Liver H. E, O.R.O., F4/80, and S.R. staining in N–C and N-CP groups. (C) Percentages of examined areas positive for F4/80 and Sirius Red. (D) LVEF, LVSV, and LVM in N–N and N-NP groups. Pre- and post-LVEF, the ratios of post/pre LVSV and post/pre LVM are shown. Scale bar: 100 µm. The results are presented as the mean ± SD, and p values were calculated using Student’s t test. *P < 0.05, N–C vs. N-CP or N–N vs. N-NP group. The number of mice in each group: N–C, n = 6; N-CP, n = 6; N–N, n = 6; N-NP, n = 6. H.E., haematoxylin–eosin; O.R.O., Oil Red O; S.R., Sirius Red; LVEF, left ventricle ejection fraction; LVSV, left ventricular stroke volume; LVM, left ventricular mass.

